Precious metals have become the focus of many researchers and traders recently. Bank of America recently raised its target to $3000 for gold (source: https://www.bloomberg.com).
In December 2019, we published a research article suggesting precious metals were setting up a long-term pattern that should result in a big breakout to the upside for gold. Every trader must understand the consequences and market dynamics that may take place if Gold rallies above $2500 over the next few months.
An upside price breakout in precious metals that has been predicted by our researcher and dozens of other analysts suggests broad market concern related to future economic growth and global debt. There is no other way to interpret the recent upside price move in Gold. Back in 2015, Gold was trading near $1060 per ounce. Currently, the price of gold has risen by nearly 64% and is trading near $1740. If gold breaks higher on a big upside move (possibly to levels above $2100 initially), this would complete a 100% upside price move from 2015 lows and would set up an incredible opportunity for further upside price legs/advancements.
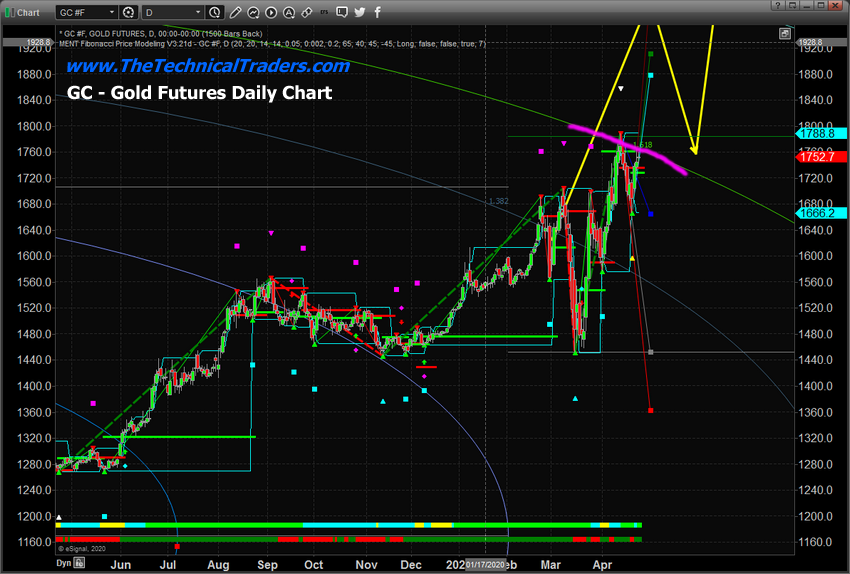
Daily Gold Chart: Fib Arcs & Tesla Price Amplitude Arcs
This Daily Gold chart highlights our proprietary Fibonacci/Tesla Price Amplitude Arcs and our Adaptive Fibonacci Price Modeling system. Although the chart may be a bit complicated to understand, pay attention to the GREEN ARC with the MAGENTA HIGHLIGHT near current price levels. This is a key price resistance arc that is about to be broken/breached. Once this level is breached with a new upside price advance, the $2100 price level becomes the immediate upside price target.
These Fibonacci Price Amplitude Arcs have become a very valuable tool for our researchers. They act as price resistance/support bubbles/arcs. When they align with price activity as price advances or declines, they provide very clear future price targets and levels where the price will run into resistance/support. Currently, the Price Amplitude Arc is suggesting that once Gold rallies above $1775, the next leg higher should target the $2000 price level, then briefly stall before rallying to levels above $2100.

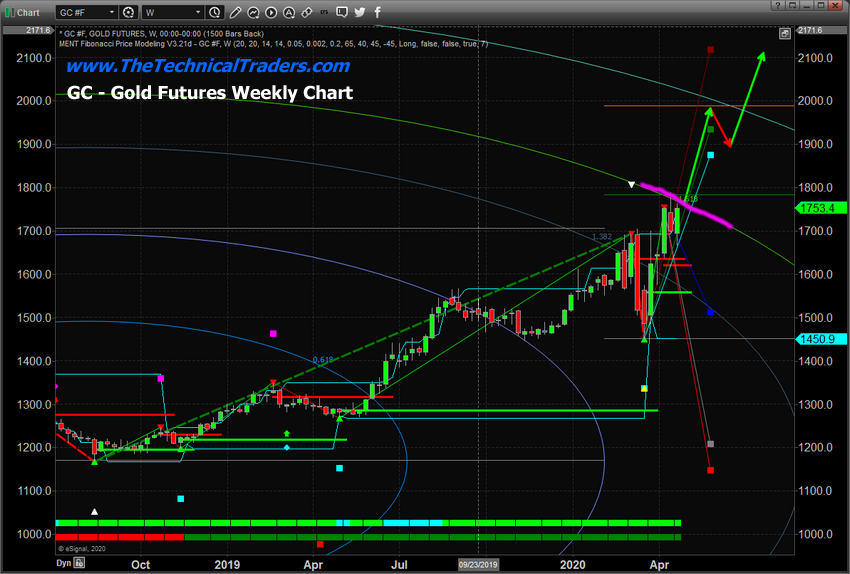
Weekly Gold Chart
This Weekly Gold chart highlighting the longer-term price picture paints a very clear picture for Gold traders. Once $1775 has been reached and the Magenta level has been broken, Gold should rally very quickly to levels above $2000, then target levels above $2100 within a few more weeks.

Concluding Thoughts
Our researchers believe Gold will eventually target $3750 from research that was completed in 2019. We suggest taking a moment to read our “Crazy Ivan” research post from early August 2019. It is critical to understand how the price setup originated near August 2019 and how it has matured recently.
It doesn’t matter what type of trader or investor you are – the move in Gold and the major global markets over the next 12+ months is going to be incredible. Gold rallying to $2100, $3000 or higher means the US and global markets will continue to stay under some degree of pricing pressure throughout the next 12 to 24 months. This means there are inherent risks in the markets that many traders are simply ignoring.
I keep pounding my fists on the table hoping people can see what I am trying to warn them about, which is the next major market crash, much worse than what we saw in March. See this article for an easy way to understand the scenario that is playing out as we speak.
