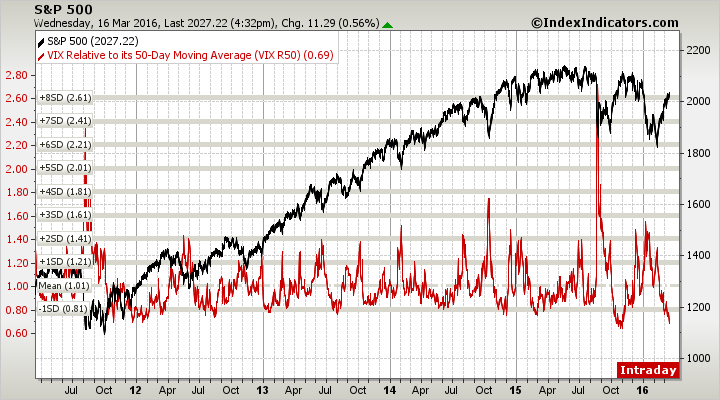
The S&P 500 has rallied over 10% since the February low, pushing the index up to its 50-week Moving Average. Meanwhile the Volatility Index VIX has declined approx. 47%, sending the ‘fear index’ to its lowest level so far this year.
One way to use Moving Averages -- aside from trend identification and areas of support and resistance -- is to measure how far a security or market is from its specified average price. Currently the VIX is the furthest it’s been from its 50-day MA since the prior lower high in the S&P 500 back in October 2015. As the chart below shows, it’s now more than one standard deviation below the mean based on the distance Volatility historically travels from its 50-day.
Previous instances of the VIX falling this quickly have led to tough market conditions in the short-term for equities. As I mentioned on Twitter (NYSE:TWTR) yesterday, the VIX is also near its 200-week Moving Average, which has been an important level in the past. Steve Deppe also shared that when the index’s 20-day return is less than -30%, the average forward turn for the S&P 500 over the next 5, 10, 20 and 40 days has been negative.
It’s important to remember that there are two ways Volatility can correct its current stretched condition -- time and price. We could see VIX move sideways and remain near 15, allowing its 50-day MA to ‘catch up’. Or we could see a bounce, sending Volatility higher. We obviously can’t know which option will occur, but it does seem that some form of mean-reversion needs to occur -- whether it be via time or a large price movement.
Disclaimer: Do not construe anything written in this post or this blog in its entirety as a recommendation, research, or an offer to buy or sell any securities. Everything in this post is meant for educational and entertainment purposes only. I or my affiliates may hold positions in securities mentioned in the blog.

