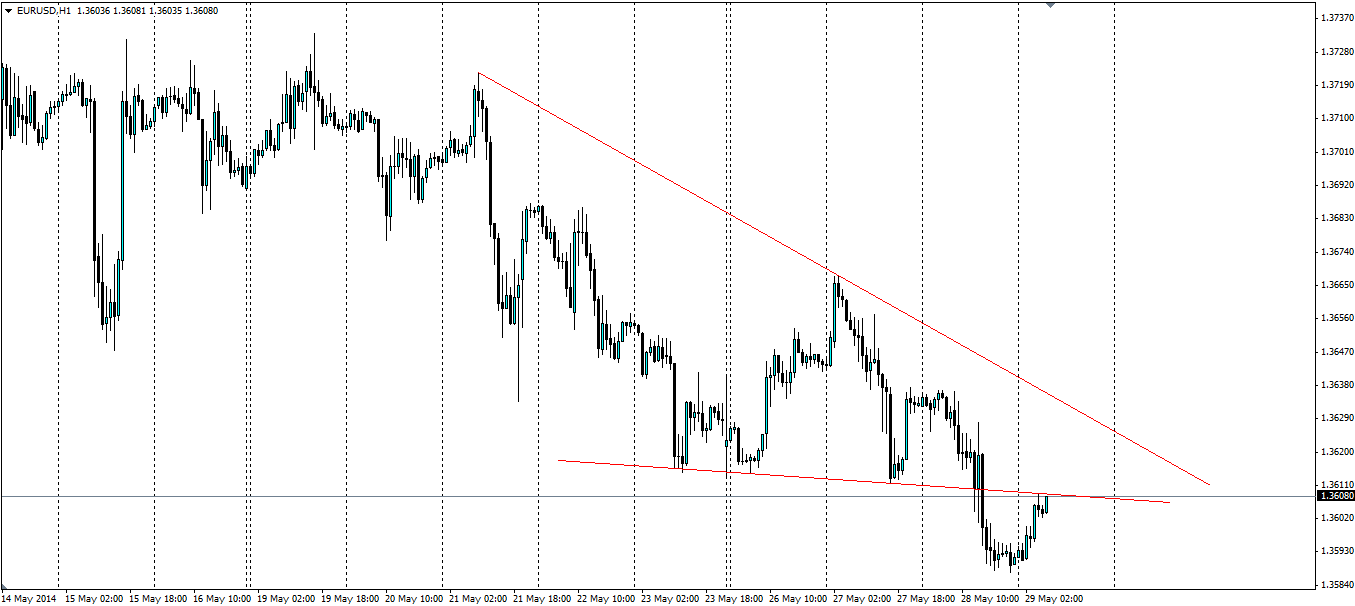
The EUR/USD H1 chart is showing an interesting support line that was broken recently having been tested several times. The line now forms resistance that has been tested once already and has so far held and the price should bounce lower off it.
The EUR/USD pair is on a downward slide with a bearish trend dominating on the H1 chart. It looked to have formed a downward sloping wedge which is a clear bearish signal, backing up current the bearish trend. This broke down yesterday as the pair smashed through it on the news that the Euro Money Supply (M3) expanded less than expected and German unemployment was up, with the market expecting a drop.

Source: Blackwell Trader
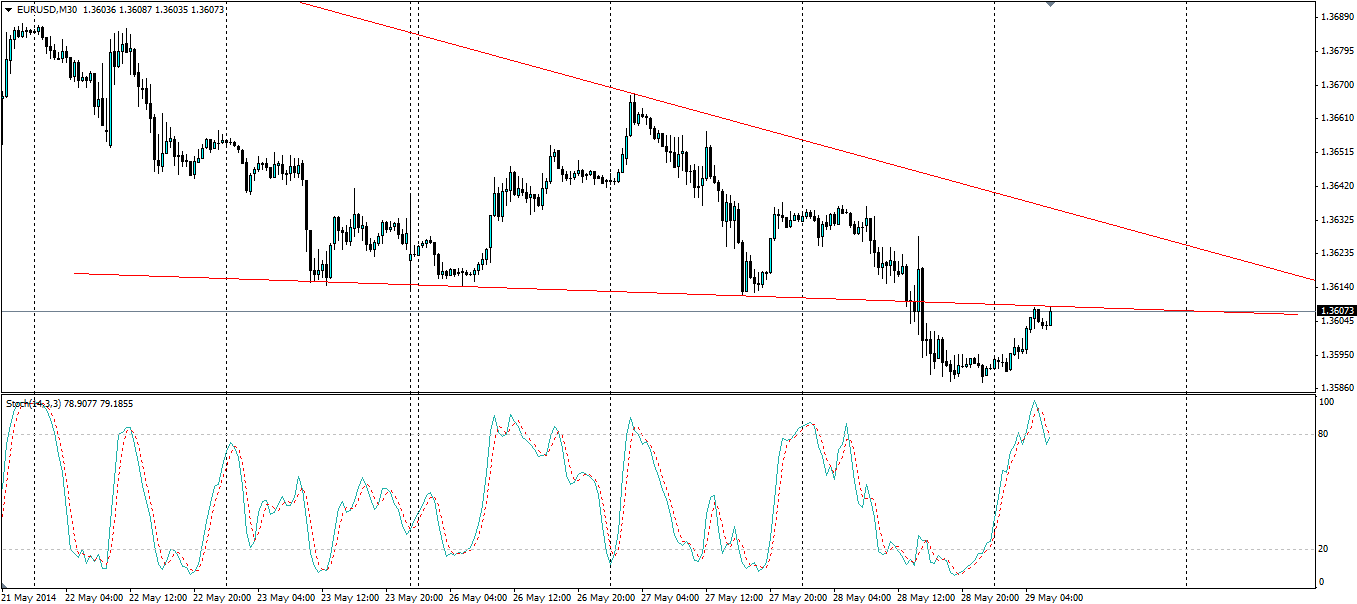
The Pair has since pulled back and has tested the previous support line and it has so far held as resistance at the 1.3608 level. This presents an opportunity to catch any bounce off this line downwards. The EUR/USD M30 looks to be testing the resistance level at present; however, the Stochastic Oscillator already looks to be showing momentum rejecting off the current levels with the previous testing of the resistance posting a much high stoch value than the present test.

Source: Blackwell Trader
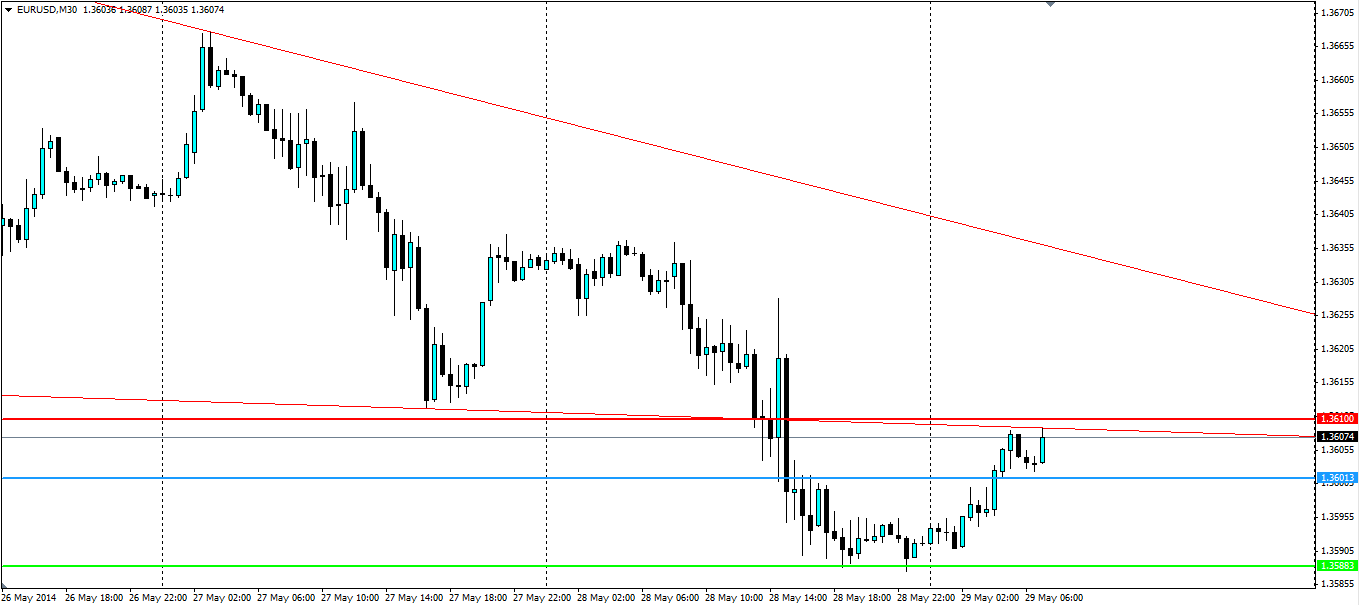
Before diving in look for the minor support at 1.3602 to break as this will be the confirmation a pullback is on the cards. A stop entry should be set below 1.3602 to catch the movement downwards, rather than trying to time it at the current levels. A stop loss can be placed above the dynamic resistance line at 1.3610 so we do not wipe out our account if the price does break through.
A target for this price action will be the recent low at 1.3588, with 1.3563 and 1.3481 being the next levels of support, but these may take a little longer to reach.

Source: Blackwell Trader
The EUR/USD charts show the breakdown of a downward sloping wedge as the price broke through. This resulted in a pullback that is currently testing the bottom of the wedge as it now forms resistance. This looks set to hold and a bounce off it could prove profitable.
