


Sign up to create alerts for Instruments,
Economic Events and content by followed authors
Free Sign Up Already have an account? Sign In
Please try another search

Per the Central Bank of Egypt (CBE), on a year-over-year basis, Egypt’s core inflation dropped to 25.53% in November compared with 30.53% in October. Core inflation excludes volatile items such as food. Urban consumer prices increased 26% in November compared with 30.8% in the previous month.
The country’s inflation has been on an upward trajectory since last November, when it floated its currency owing to the loan deal with the International Monetary Fund (IMF). Other prerequisites for the $12 billion loan were to hike taxes and reduce subsidies.
Interest Rate Woes
In order to tackle inflation woes, Egypt’s central bank hiked its key interest rate in early July by 200 basis points to 18.75%. Since November 2016, interest rates have been hiked by 700 basis points. The central bank drew strong criticism from businesses for its actions, as business leaders showed concerns over stifling growth owing to the rise in borrowing cost.
Egypt's finance minister Amr El Garhy expects inflation to fall in early 2018. He eyes 20% inflation by January 2018 and 13-14% by August. The central bank has set a target of 13% inflation for the fourth quarter of 2018. Economists expect rate cuts in the coming months as post-float inflation woes ease.
Current Account and Trade Deficit
Egypt’s current account deficit in the first quarter of fiscal 2017-2018 dropped to $1.6 billion. Moreover, the trade deficit narrowed 5% to $8.9 billion from $9.4 billion as a result of rise in exports.
The overall balance of payments surplus increased to $5.1 billion compared with $1.9 billion in the same period a year earlier.
In the current scenario, let us discuss the most popular ETFs providing exposure to Egyptian equities.
VanEck Vectors Egypt Index ETF EGPT
This fund seeks to provide exposure to the emerging market of Egypt, serving as a pure play on the economy.
It has AUM of $69.9 million and is a relatively expensive bet as it charges a fee of 1.01% a year. From a sector look, Financials, Real Estate and Telecommunication Services are the top three sector allocations of the fund, with 23.4%, 23.2% and 12.8% exposure, respectively (as of Nov 30, 2017). From an individual holding perspective, Eastern Tobacco, Egypt Kuwait Holding Co Sae and Global Telecom Holding Sae are the top three allocations of the fund, with 7.9%, 7.5% and 7.3% exposure, respectively (as of Dec 11, 2017). The fund has returned 22.8% year to date and 25.3% in a year (as of July 10, 2017). EGPT has a Zacks ETF Rank #4 (Sell) with a High risk outlook.
Let us now compare the performance of this ETF to a broad-based Africa ETF (see all Africa-Middle East Equity ETFs here).
VanEck Vectors Africa Index ETF (OL:AFK)
This fund has almost 60% exposure to African nations. It covers economies like South Africa, Egypt, Nigeria, Morocco, Kenya, and Mauritius. It also invests in offshore listings of companies incorporated outside Africa but generate at least 50% of their revenues from the continent.
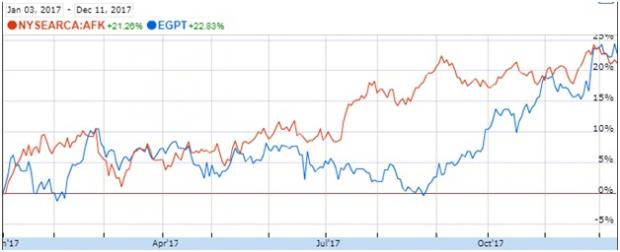
It has AUM of $75.1 million and charges 79 basis points in fees per year. It has a 6.3% allocation to Egypt (as of June 30, 2017). Financials, Materials and Consumer Discretionary are the top three sector allocations of the fund, with 36.4%, 17.5% and 13.3% exposure, respectively (as of Nov 30, 2017). From an individual holding perspective, Naspers Ltd, Commercial International Bank Egypt Sae and Safaricom Ltd are the top three allocations of the fund, with 9.6%, 6.2% and 5.9% exposure, respectively (as of Dec 11, 2017). The fund has returned 21.3% year to date and 19.2% in a year (as of Dec 11, 2017). AFK has a Zacks ETF Rank #3 (Hold) with a Medium risk outlook.
Below, is a chart comparing the year-to-date performance of the two funds.
Want key ETF info delivered straight to your inbox?
Zacks’ free Fund Newsletter will brief you on top news and analysis, as well as top-performing ETFs, each week. Get it free >>
Shares of Alibaba (NYSE:BABA) are on a tear to start off 2025. The consumer discretionary and tech stock is up by 52% this year as of the Feb. 25 close. The company’s cloud...
Every investor should know the term CEP, or customer engagement platform, because it is central to businesses' use of AI. CEPs provide software services to connect and communicate...
As markets try to look through the blizzard of policy changes flowing out of Washington, the crowd has shifted its preferences considerably in recent weeks based on a sector lens....
Are you sure you want to block %USER_NAME%?
By doing so, you and %USER_NAME% will not be able to see any of each other's Investing.com's posts.
%USER_NAME% was successfully added to your Block List
Since you’ve just unblocked this person, you must wait 48 hours before renewing the block.
I feel that this comment is:
Thank You!
Your report has been sent to our moderators for review
Add a Comment
We encourage you to use comments to engage with other users, share your perspective and ask questions of authors and each other. However, in order to maintain the high level of discourse we’ve all come to value and expect, please keep the following criteria in mind:
Enrich the conversation, don’t trash it.
Stay focused and on track. Only post material that’s relevant to the topic being discussed.
Be respectful. Even negative opinions can be framed positively and diplomatically. Avoid profanity, slander or personal attacks directed at an author or another user. Racism, sexism and other forms of discrimination will not be tolerated.
Perpetrators of spam or abuse will be deleted from the site and prohibited from future registration at Investing.com’s discretion.