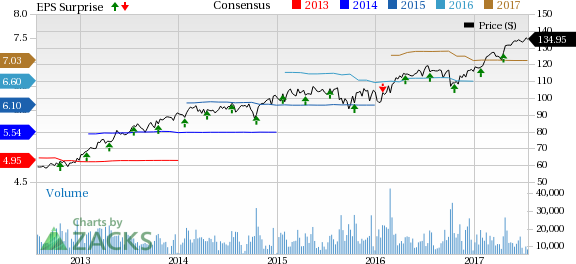
Honeywell International Inc.’s (NYSE:HON) second-quarter 2017 adjusted earnings and revenues surpassed the respective Zacks Consensus Estimate by 1.1% and 2.5%.
Earnings
Quarterly adjusted earnings came in at $1.80 per share, higher than the Zacks Consensus Estimate of $1.78. The bottom line also comfortably surpassed the year-ago tally of $1.64 per share.
The quarterly GAAP earnings per share of $1.80 exceeded the year-ago tally of $1.70. The company noted that this upside was driven by an increase in revenues.
Revenues
Net sales during the quarter came in at $10,078 million compared with $9,991 million in the prior-year quarter, driven by organic growth across all of its segments. In addition, the top line surpassed the Zacks Consensus Estimate of $9,835 million.
Costs and Margins
Total cost of goods sold during the quarter was $6,850 million compared with $6,821 million in the prior-year period. Selling, general and administrative expenses came in at $1,381 million, up 3.9% year over year. Interest expenses and other financial charges during the quarter were $79 million compared with $85 million in the year-ago quarter.
Segmental profit margin was 19%, up 50 basis points (bps) year over year. Operating income margin declined 10 bps to 18.3%.
Segment Performance
Honeywell International reports results in terms of four business segments:
Home and Building Technologies’ revenues were $2,736 million, up 2% year over year. The upside was backed by Smart Energy program roll-outs, air and water product sales in China, and continued growth in the Distribution business.
Safety and Productivity Solutions’ revenues totaled $1,429 million, up 30% year over year. The year-over-year growth was driven by higher volumes in workflow solutions and safety products businesses.
However, revenues of Aerospace sales during the quarter came in at $3,674 million compared with $3,779 million in the year ago quarter.
Also, Performance Materials and Technologies’ sales during the quarter came in at $2,239 million, down 8% year over year.
Balance Sheet and Cash Flow
Cash and cash equivalents as of Jun 30, 2017 were $7,877 million, while long-term debt was $11,329 million.
At the end of the quarter, net cash from operating activities was $1,447million compared with $1,583 million in the prior-year period. Free cash flow was $1,214 million during the quarter compared with $1,302 million in the year-ago quarter.
Outlook
Honeywell International aims at boosting its near-term results on the back of strategic investments, greater operational efficacy and stronger demand for its diversified products. The company raised its earnings and revenue guidance for 2017. Its earnings per share is currently expected in the range of $7.00−$7.10 (from $6.90 – $7.10), while revenues are expected in the range of $39.3−$40 million (earlier expectation was $38.6 –$39.5 million).
Honeywell currently carries a Zacks Rank #2 (Buy). Some other stocks in the industry worth a glance include NV5 Global, Inc. (NASDAQ:NVEE) , Gartner, Inc. (NYSE:IT) and Exponent, Inc. (NASDAQ:EXPO) . NV5 Global and Gartner both carry the same Zacks Rank as Cintas (NASDAQ:CTAS), while Exponent sports a Zacks Rank #1(Strong Buy). You can seethe complete list of today’s Zacks #1 Rank stocks here.
NV5 Global has a long-term earnings growth expectation of 20%.
Gartner has a long-term earnings growth expectation of 17.33%.
Exponent has a long-term earnings growth expectation of 12%
Will You Make a Fortune on the Shift to Electric Cars?
Here's another stock idea to consider. Much like petroleum 150 years ago, lithium power may soon shake the world, creating millionaires and reshaping geo-politics. Soon electric vehicles (EVs) may be cheaper than gas guzzlers. Some are already reaching 265 miles on a single charge.
With battery prices plummeting and charging stations set to multiply, one company stands out as the #1 stock to buy according to Zacks research.
It's not the one you think.
See This Ticker Free >>
Gartner, Inc. (IT): Free Stock Analysis Report
Honeywell International Inc. (HON): Free Stock Analysis Report
Exponent, Inc. (EXPO): Free Stock Analysis Report
NV5 Global, Inc. (NVEE): Free Stock Analysis Report
Original post
Zacks Investment Research

