The recent volatility in the Dow Jones Industrial Average, the S&P 500 and the Nasdaq Composite Index has really made many investors nervous about the state of the stock market. Volatility often follows a period of nice trending up. While volatility is the enemy of the investor, it can often be the friend of the trader. Volatile periods in the market can be great trading opportunities for short term traders.
Some may question whether there is a need to study the charts of the indices. However, experience will tell you that you should not ignore price action. Price action represents the collective decisions of market participants. They represent the hope and fears of traders and investors. Which is why you should never ignore what the charts are telling you. If you are good at reading the psychology of market participants, you might be able to take advantage of the situation.
Now and then, the collective action of market participants will form some very reliable chart patterns that appear again and again at market turning points. That is why chart patterns such as the double bottom and the double top can often be found at significant reversal areas in the stock market. At other times, continuation patterns such as the ascending triangle, the pennant, and the triangle can form which give us hints that the market may continue to go up.
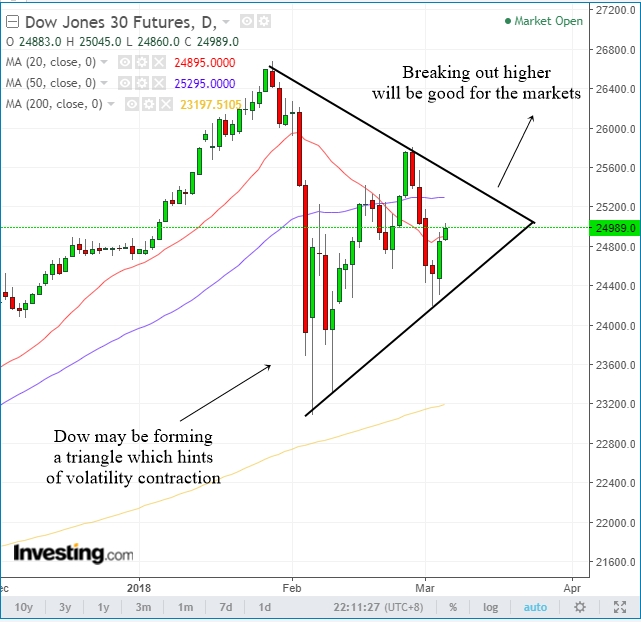
I believe at this moment, the Dow Jones might be forming a triangle in the daily charts. Take a look at the daily chart of the Dow Jones Industrial Average futures below.
Most readers will realize that a triangle can be a continuation pattern. The triangle is made up of highs and lows that are slowly contracting to the center of the pattern. In other words, the index's price action will be experiencing a volatility contraction. As the pattern forms, price will be less volatile until it reaches an apex point and breaks out. This is exactly what Dow is experiencing right now and an astute trader or investor will not ignore this fact.
While we do not know which direction Dow will eventually break out into, a triangle will usually resolve itself in the direction of the previous trend. Since the previous trend for the Dow is up, therefore we should have a bullish bias.

