On Wednesday, following Ben Bernanke's final meeting as chairman, the Federal Reserve announced that it will taper its bond-buying program to $65 billion in February, down from $75 billion in January.
Addressing the decision to taper and the disappointing December employment report, the Fed stated; "Labor market indicators were mixed but on balance showed further improvement."
The central bank also noted "growing underlying strength in the broader economy."
Current Vice Chair Janet Yellen is set to take over as chairperson, and will preside over the next Fed policy committee meeting scheduled for March 18.
The reduction of stimulus was widely expected by analysts and the U.S. dollar's initial reaction to the news was muted. However, the greenback rallied in early trading on Thursday ahead of the Initial Jobless Claims and GDP figures released at 8:30 a.m. EST.
The Department of Labor announced that Initial Jobless Claims missed expectations of 330K, coming in at 348K. Meanwhile, Continuing Jobless Claims beat expectations of 3,020K coming in at 2.991 million.
The Commerce Department reported that U.S. GDP quarter-over-quarter came out in line with expectations at 3.2 percent. Fourth quarter GDP slowed from the third-quarter's 4.1 percent rise. However, growth over the second half of 2013 posted a pace of 3.7 percent, higher than the 1.8 percent growth rate recorded in the first half of the year.
Later in the morning Pending Home Sales initially pressured the dollar, coming in at -8.7 percent, missing analyst expectations of 0.3 percent by a wide margin. The figure marked the lowest reading since October 2011 and analysts noted that unusually cold weather was likely to have contributed to the fall. Amid the slew of mixed but largely positive data, the dollar was able to shrug off the negative pending home sales figure and make new highs on the day.
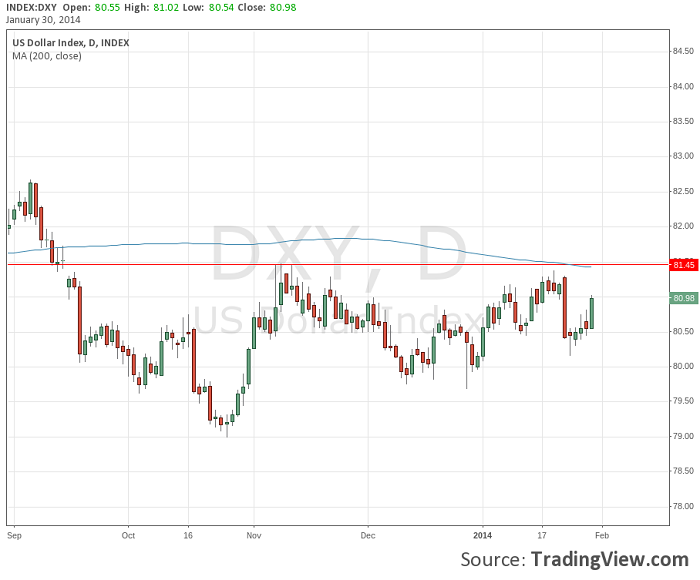
U.S. Dollar Index Daily Chart
Looking at the U.S. dollar index daily chart we can see that price is nearing a key area of resistance at around 81.45, where there is a confluence of prior highs and the 200 day simple moving average.