Most of you have probably heard about how copper is a good leading indicator of how the economy is going. So much so that it is referred to as “Doctor Copper”. As Investopedia puts it:
The term Doctor Copper is market lingo for the base metal that is reputed to have a Ph.D. in economics because of its ability to predict turning points in the global economy. Because of copper’s widespread applications in most sectors of the economy — from homes and factories to electronics and power generation and transmission — demand for copper is often viewed as a reliable leading indicator of economic health.
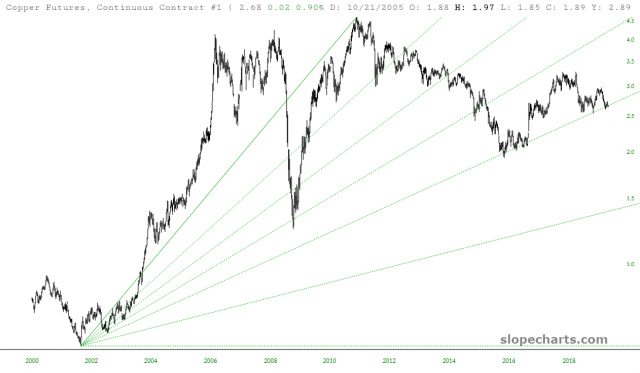
My fixation on my short position in XME) led me to poke around this topic a bit. On the one hand, the long-term continuous contract of copper is fascinating, and it is one of the rare instances in which the Fibonacci arc is actually helpful. Take note how important the present fan line is for support.

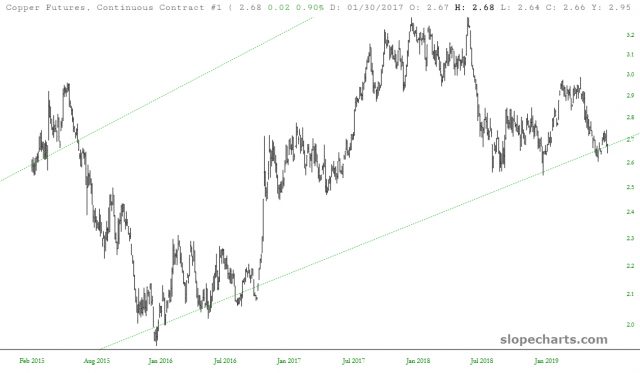
Here is a closer look. The relationship of price action to that fan line is just uncanny. If it breaks, look out below!

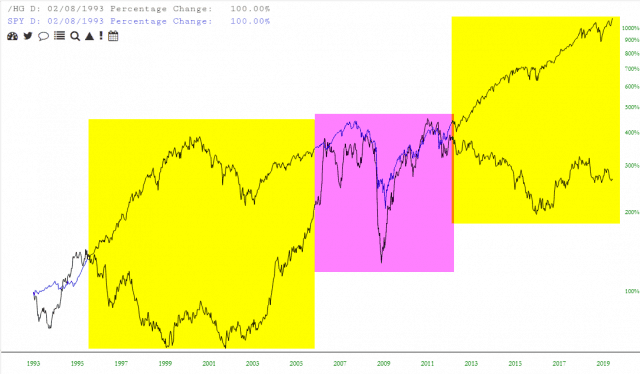
On the other hand, the notion of copper being some kind of be-all, end-all soothsayer with respect to the economy (and, in turn, equities) seems misplaced. Below are the two graphs, the SPY (NYSE:SPY) and copper. Sure, there are instances in which they are closely correlated (magenta tint), but to my eyes, for the majority of the time, they have just about nothing to do with each other.

