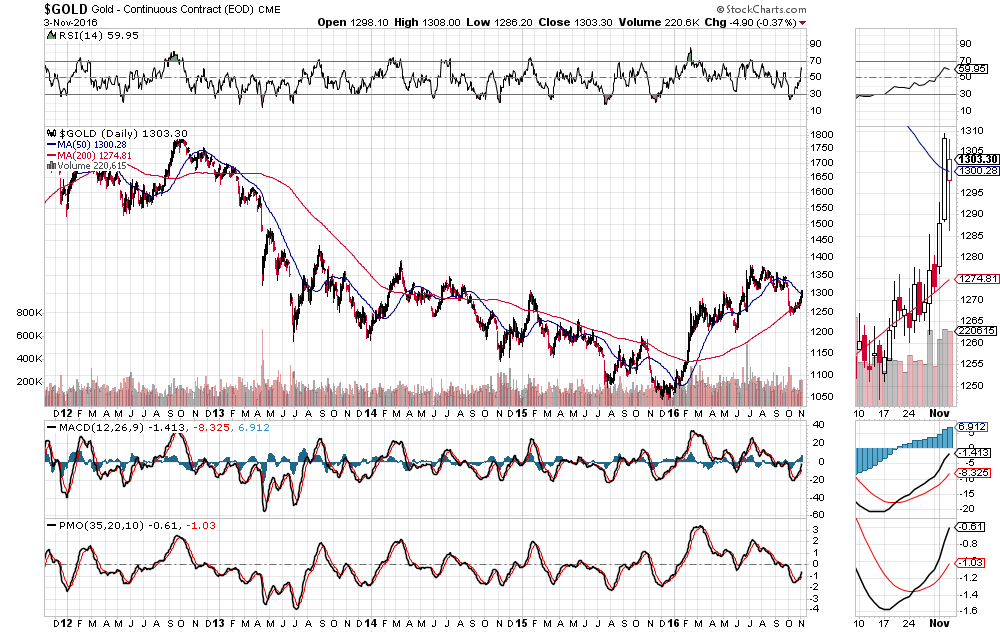
Gold closed just above 1300 and the 50 MA for a second day in a row, as shown on the following daily chart. The RSI and MACD downtrends have now been broken to the upside.
The next major resistance level is around 1400. I'd watch to see if the PMO indicator crosses and holds back above zero to see whether such a rally, or continued rally beyond that level, has legs.
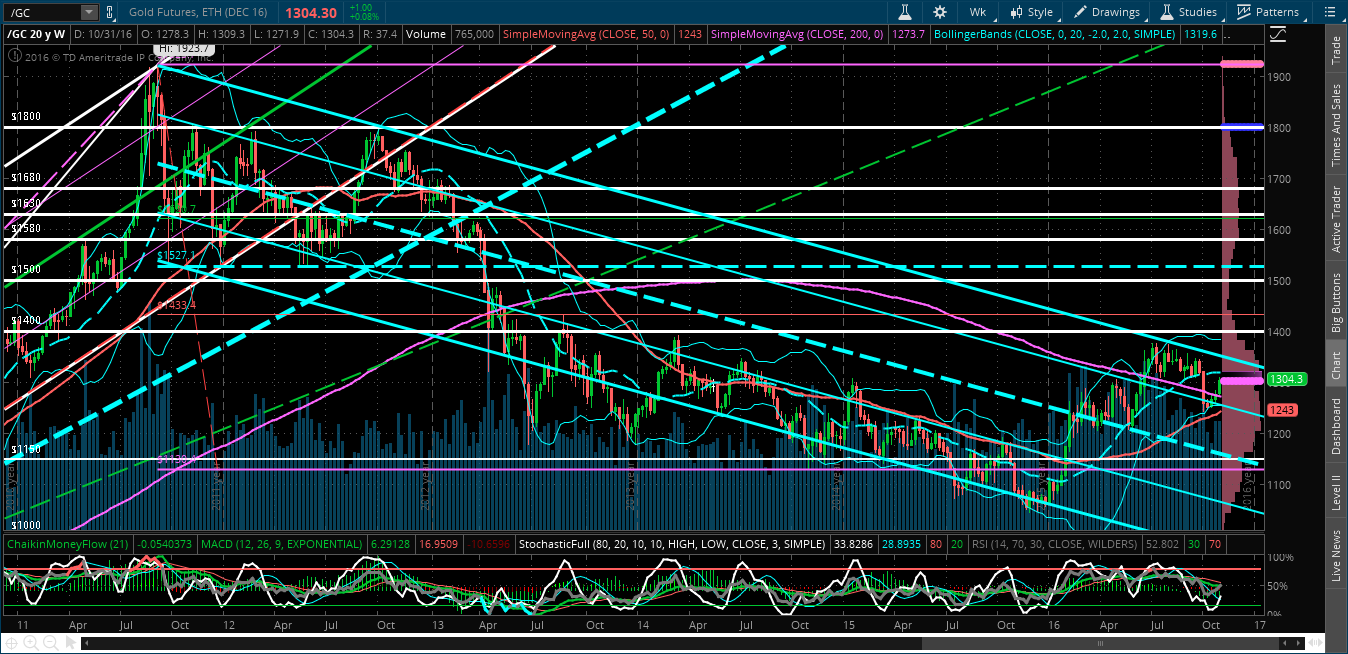
In fact, there is thin volume above 1400, as depicted by the pink Volume Profile along the right-hand side of the weekly chart below, so you could see a price surge above 1400 to, potentially, 1500, which is the next major resistance level. Watch for a Golden Cross of the 50 MA back above the 200 MA on this timeframe to confirm such a surge.


