


Sign up to create alerts for Instruments,
Economic Events and content by followed authors
Free Sign Up Already have an account? Sign In
Please try another search

Shares of CF Industries Holdings, Inc. (NYSE:CF) scaled a fresh 52-week high of $45 on Mar 6, before closing the day at $43.20.
CF Industries has a market cap of roughly $10.1 billion. Average volume of shares traded in the last three months is around 3,321.5K. The company has an expected long-term EPS growth rate of 8%.
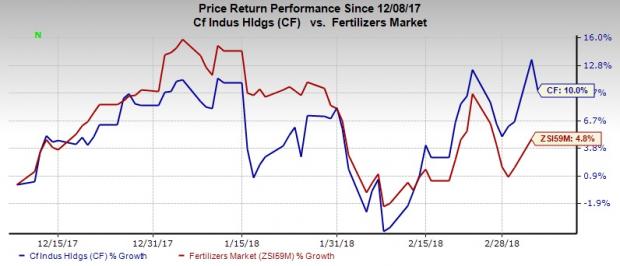
The stock has rallied 10% in the past three months, outperforming the industry’s 4.8% growth.
Driving Factors
Better-than-expected fourth-quarter 2017 earnings performance and a positive outlook have been driving the stock lately.
CF Industries swung to a profit in the fourth quarter aided by a sizable tax benefit. The company logged a profit of $465 million or $1.98 per share in the quarter against a loss of $320 million or $1.38 per share a year ago. Adjusted loss came in at 2 cents per share for the fourth quarter, which was narrower than the Zacks Consensus Estimate of a loss of 11 cents.
The company expects higher energy costs in major producing regions, lower production in China, a weaker U.S. dollar, increased oil and freight costs and a steady global demand to support nitrogen prices during first-half 2018 at levels higher than the comparable period a year ago.
CF Industries benefits from higher nitrogen demand driven by healthy corn plantations and cyclical recovery in the nitrogen fertilizer industry. The company expects India and Brazil to be major drivers for urea demand in 2018. Based on the company’s analysis and published reports, India is expected to require the import of 500,000-1,000,000 metric tons of urea prior to end of March to meet its fertilizer requirements for this year.
Brazil also imported roughly 5.4 million metric tons of urea in 2017, up 15% year over year, and has emerged as a major importer of the nutrient. Import demand is also expected to be healthy in North America in 2018.
CF Industries should also benefit from its efforts to boost production capacity. The company completed a new 400,000-ton urea equivalent per year DEF unit at the Donaldsonville complex in 2017 to support the growth of its diesel fluid business.
CF Industries Holdings, Inc. Price and Consensus
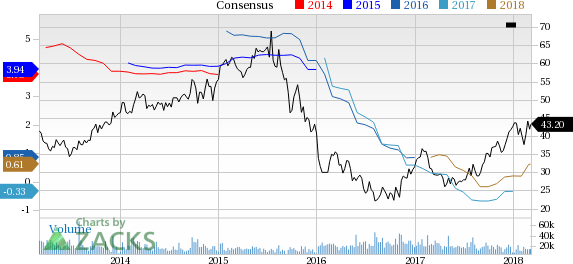
CF Industries Holdings, Inc. Price and Consensus | CF Industries Holdings, Inc. Quote
Zacks Rank & Other Stocks to Consider
CF Industries currently sports a Zacks Rank #1 (Strong Buy).
Some other top-ranked stocks in the basic materials space are Steel Dynamics, Inc. (NASDAQ:STLD) , Westlake Chemical Corporation (NYSE:WLK) and United States Steel Corporation (NYSE:X) , each flaunting a Zacks Rank #1. You can see the complete list of today’s Zacks #1 Rank stocks here.
Steel Dynamics has an expected long-term earnings growth rate of 12%. Its shares have soared 37.3% over the last six months.
Westlake Chemical has an expected long-term earnings growth rate of 12.2%. Its shares have moved up 53% over the past six months.
U.S. Steel has an expected long-term earnings growth rate of 8%. Its shares have rallied 65.2% over the last six months.
Breaking News: Cryptocurrencies Now Bigger than Visa
The total market cap of all cryptos recently surpassed $700 billion – more than a 3,800% increase in the previous 12 months. They’re now bigger than Morgan Stanley (NYSE:MS), Goldman Sachs (NYSE:GS) and even Visa! The new asset class may expand even more rapidly in 2018 as new investors continue pouring in and Wall Street becomes increasingly involved.
Zacks has just named 4 companies that enable investors to take advantage of the explosive growth of cryptocurrencies via the stock market.
Click here to access these stocks. >>
Shares of Alibaba (NYSE:BABA) are on a tear to start off 2025. The consumer discretionary and tech stock is up by 52% this year as of the Feb. 25 close. The company’s cloud...
Every investor should know the term CEP, or customer engagement platform, because it is central to businesses' use of AI. CEPs provide software services to connect and communicate...
As markets try to look through the blizzard of policy changes flowing out of Washington, the crowd has shifted its preferences considerably in recent weeks based on a sector lens....
Are you sure you want to block %USER_NAME%?
By doing so, you and %USER_NAME% will not be able to see any of each other's Investing.com's posts.
%USER_NAME% was successfully added to your Block List
Since you’ve just unblocked this person, you must wait 48 hours before renewing the block.
I feel that this comment is:
Thank You!
Your report has been sent to our moderators for review
Add a Comment
We encourage you to use comments to engage with other users, share your perspective and ask questions of authors and each other. However, in order to maintain the high level of discourse we’ve all come to value and expect, please keep the following criteria in mind:
Enrich the conversation, don’t trash it.
Stay focused and on track. Only post material that’s relevant to the topic being discussed.
Be respectful. Even negative opinions can be framed positively and diplomatically. Avoid profanity, slander or personal attacks directed at an author or another user. Racism, sexism and other forms of discrimination will not be tolerated.
Perpetrators of spam or abuse will be deleted from the site and prohibited from future registration at Investing.com’s discretion.