Much is going right as it relates to the equity markets around the globe; however, this past week saw the market punish companies that reported earnings that did not match market expectations. The below 2-week chart only lists a few of those companies, but companies like Celgene (NASDAQ:CELG) down 28.1% and Expedia (NASDAQ:EXPE) down 17.5% suffered much of their losses on one or just a few trading days. 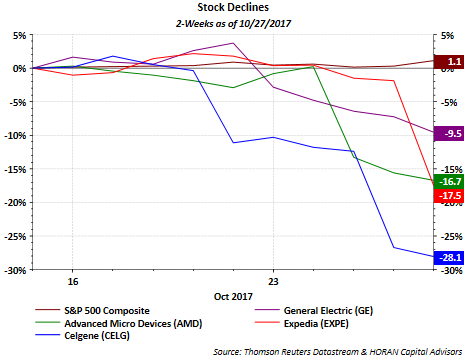
These sharp declines have impacted a handful of stocks, but investors should evaluate their own reaction to this type of decline in a single stock in the event a double digit decline materializes for the entire market. The S&P 500 Index has gone 338 trading days without a pullback of more than 5% which began in June of last year. 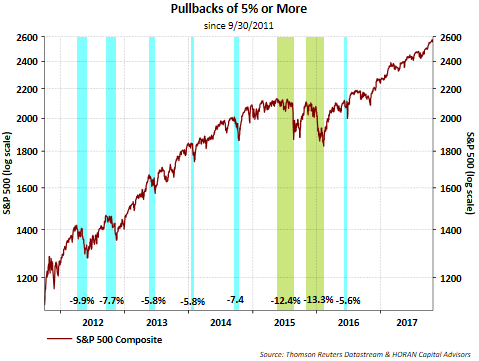
In a recent article by Alan Steel, “First, Do No Harm…”, he notes,
“historically speaking, markets eventually go down. And a look at double digit losses in the S&P 500 from 1928 to 2016 shows the following averages: 5% losses three times a year, 10% losses once a year, 15% losses once every two years, and 20% losses once every three to four years. In other words, once every four years an asteroid destroys part of the village.”
Given the strength in the equity markets since the end of the financial crisis, now is a good time for investors to review the allocation of their investments as it relates to target levels they are comfortable with. As noted above, 5% and 10% equity market declines occur more frequently than investors have recently experienced. These out-sized pullbacks by a few individual stocks may serve as a cautionary variable for investors. Also, the Advance-Decline Volume Line, a breadth indicator based on Net Advancing Volume, which is the volume of advancing stocks less the volume of declining stocks, is showing some negative divergence. When declining volume exceeds advancing volume, this can be an indication of a potential reversal in the respective index. 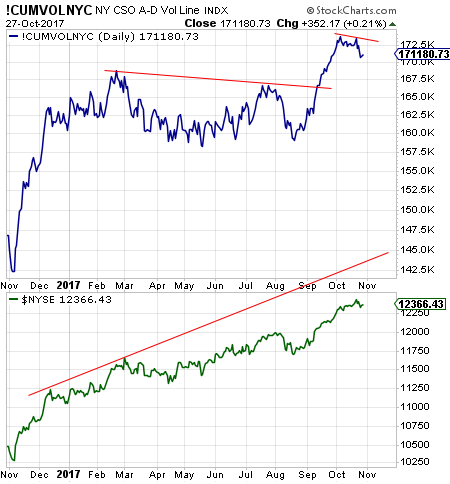
Importantly, company fundamentals seem to be improving at a time economies around the globe seem to be in sync as it relates to positive growth. Not only are companies generating positive earnings growth, expected to grow low double digits this year and low double digits again in 2018 in the U.S., but top line revenue growth is now being realized. Friday's U.S. GDP growth for the third quarter was reported at 3.0% marking back to back quarters of 3.0%+ GDP growth for the first time since 2014. This and other economic data suggests the economy is strengthening as well. These positive factors have not gone unnoticed by many investors resulting in strong year to date equity returns around the world. 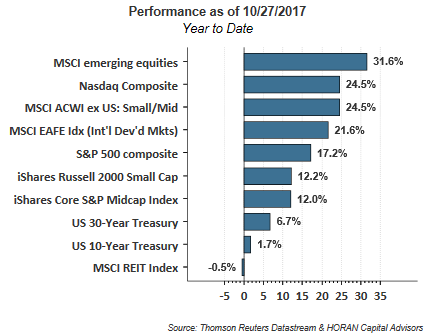
The strongest equity returns are being generated in markets outside the U.S. as can be seen in the above performance chart. The emerging market index return is almost double the S&P 500 Index return. The strong returns being generated in non-U.S. markets are supported by improving company fundamentals. As the below chart shows, where U.S. earnings (maroon line) exhibited strength since the end of the financial crisis, emerging market and EAFE related earnings growth is now accelerating relative to the U.S. as can be seen by the steeper slope of the their lines, the blue and green lines below. 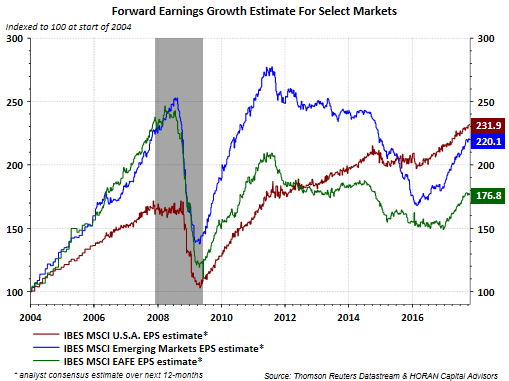
The point for investors is a market pullback is overdue and could be of the magnitude experienced recently by a few individual stocks. Given the strength of equity returns, especially in the U.S., now is a good time to review ones overall asset allocation. However, based on what we see today we do not anticipate a recessionary environment near term and believe a pullback would be healthy and a part of normal equity market action.
Disclosure: Firm/Family long CELG
