Crypto-Statistics
In the last issue of Seasonal Insights I discussed how the S&P 500 index performs on individual days of the week. In this issue I will show an analysis of the average cumulative annual returns of bitcoin on individual days of the week.
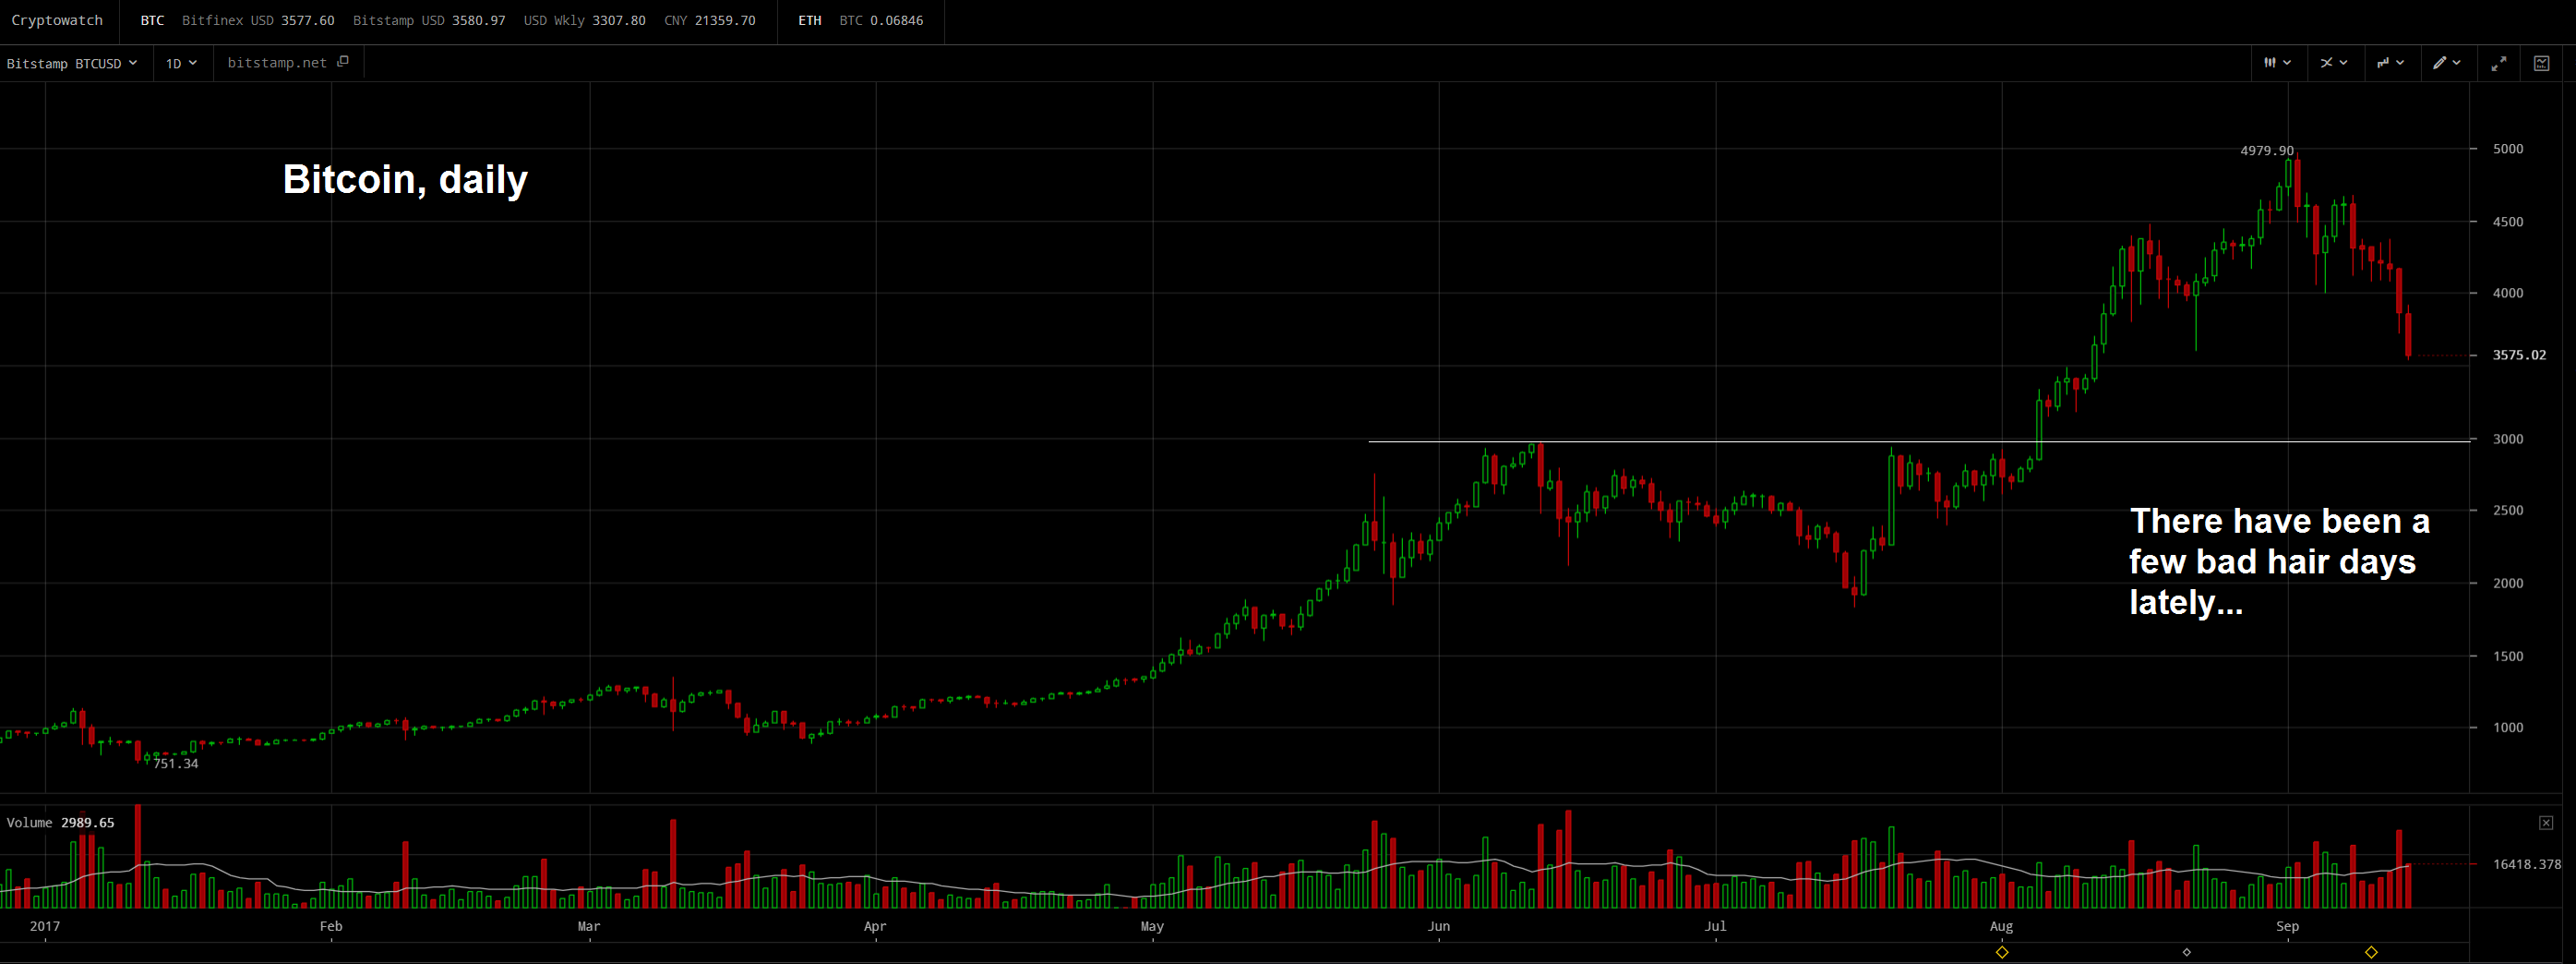
While this is beside the point, we note the crypto-currency (and other “alt coins” as well) has had minor performance issues lately. The white line indicates important lateral support, but this looks to us like it could be the beginning of a higher-degree correction, mainly because it so far proceeds with greater verve than previous corrections over the past year. Besides, the recent rally in this trading sardine seems rather stretched, and the term stretched by itself actually sounds inadequate as a descriptor. It needs an adverb… insanely might do.
It seems to me that bitcoin is particularly interesting for this type of study: it exhibits spectacular price gains, it is a very new instrument and it is unregulated. Moreover, it trades around the clock, even on weekends.
Given this setup, I found myself wondering: do prices rise uniformly? And does their performance on weekends differ from workdays?
The Action Mainly Takes Place At Beginning Of The Week
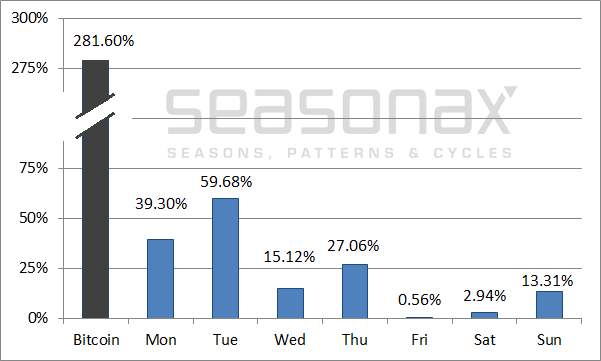
The first chart below shows the annualized performance of bitcoin since 2011 in black, as well as the cumulative annualized performance on individual days of the week in blue.
Note: due to the extent of the rally to date, the compounding effect is particularly strong; the average cumulative returns achieved on individual days of the week, therefore, don’t add up linearly to the total annualized return of bitcoin. I have inserted a break in the black column and the scale of the y-axis in order to improve the clarity of the chart.

Bitcoin, performance by individual days of the week, 2011 to 2017. On Fridays and Saturdays the average gain in bitcoin was negligible.
As the chart shows, the beginning of the week stands out noticeably: if one had invested exclusively on Mondays, an annual return of 39.30 percent would have been attained. The cumulative gain achieved on Tuesdays was even stronger at 59.68 percent.
By contrast, the average return of 0.56% achieved on Friday was essentially irrelevant. In short, even in bitcoin, there were days of the week that on average generated almost no gain. Moreover, Saturdays, and by the standards of bitcoin also Sundays and Wednesdays, were rather boring days as well.
The difference in the average annual returns achieved on individual days of the week – measured over no less than 2,333 trading days – is significant. This suggests that it is highly unlikely to be a random pattern.
Next we will take a look at the evolution of these trends over time in detail.
The Days Of The Week
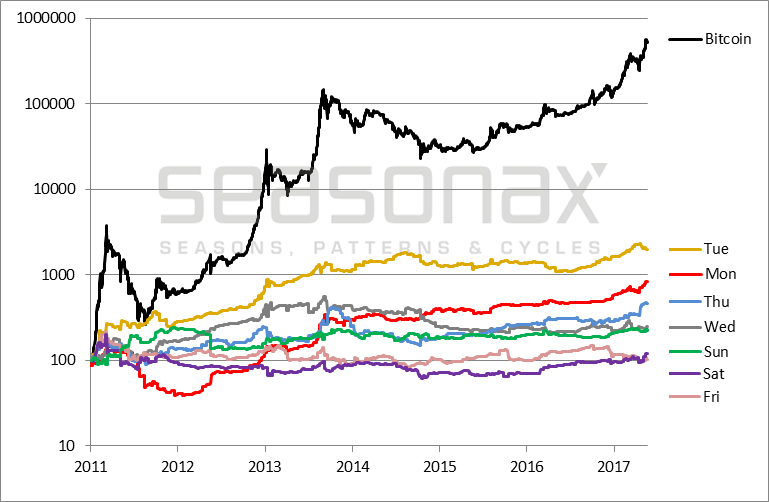
The next chart shows bitcoin's performance since 2011 in black, as well as the cumulative return achieved on every individual day of the week in other colors – indexed to 100.
Bitcoin, cumulative returns by day of the week, 2011 – 2017, indexed. Tuesday is the clear winner.
As the chart shows, Tuesday (yellow line) was well ahead of the pack from the very beginning. By contrast, Monday initially performed poorly, but later caught up rapidly, especially after 2012. Fridays and Saturdays were boring days for bitcoin traders throughout the entire period.
What Causes Bitcoin To Rally At The Beginning Of The Week?
The results of this study underscore that even a very young market that has experienced extraordinary price gains (for which normally a great many trading days should be required), exhibits very conspicuous statistical anomalies.
How can these anomalies be explained? My theory is that many people interested in bitcoin arrive at the decision to make a purchase over weekends. These decisions are then implemented at the beginning of the week. The first purchases are made on Mondays. On Tuesdays those who were waiting for confirmation from rising prices follow suit and buy as well. Thereafter the action tails off until the beginning of the next week.
Bitcoin Shows That Exploitable Market Discrepancies Exist.
What do the statistical anomalies in bitcoin tell us about investing in financial markets?
Contrary to what some theories assert, efficient markets do not exist in the real world. Human habits, regulations or manipulation can result in recurring disparities in price patterns. Statistical oddities and many other patterns can be quickly found with the help of the Seasonax app on Bloomberg or Thomson-Reuters systems; they exist in stock markets, currencies and commodities as well. Don’t let the apostles of the efficient market hypothesis keep you from taking advantage of them.
Charts by: Cryptowatch, Seasonax


