The Australian Bureau of Statistics released the consumer price index data for the third quarter. Official records showed that CPI advanced 1.3% on the year in the third quarter of 2016, exceeding forecasts of 1.1% and gaining from the one percent increase from the previous quarter. On a quarterly basis, inflation rose 0.7% beating forecasts of 0.5% and rising from 0.4% in Q2. Although inflation is still low and below the RBA’s inflation target, the improvement in CPI from a year ago and on a quarterly basis is reason enough to keep the RBA on hold at its meeting next week, which should offer some support to the AUD in the near term.
AUD/USD Daily Analysis

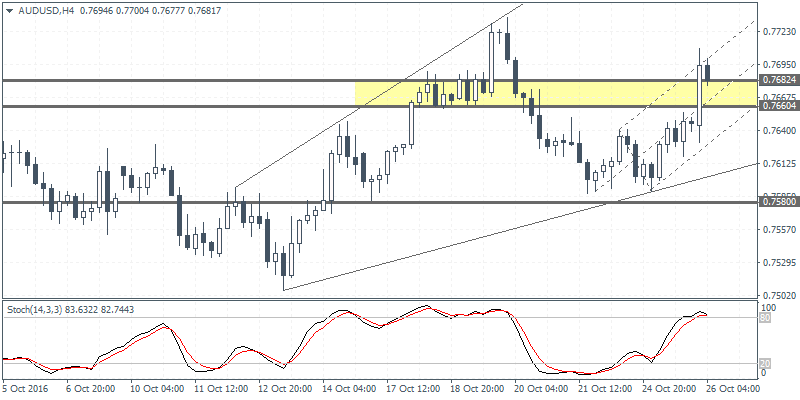
AUD/USD (0.7681) advanced its gains yesterday and is seen maintaining the bullish momentum after the quarterly inflation report that was released today. However, the 4-hour chart shows the AUD/USD moving in a widening wedge pattern with price closing above the 4-hour resistance zone of 0.7682 - 0.7660. We could expect the price to remain consolidated near the current levels, but the upside momentum is seen weakening. A close below the resistance zone's low of 0.7660 could signal near term declines towards 0.7580. Watch for a median line failure plotted within the broadening wedge pattern for early clues as AUD/USD looks to post declines if price fails to hold up above 0.7682.
EUR/USD Daily Analysis

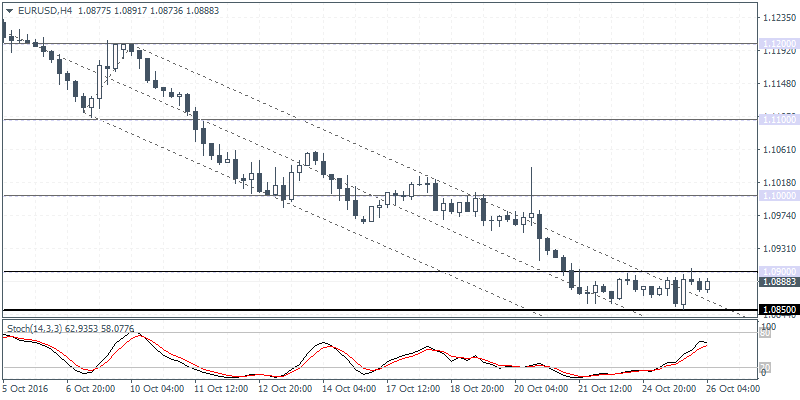
EUR/USD (1.0888) dipped to lows of 1.0850 yesterday and closed modestly bullish and in the process formed a doji outside thebar. A follow through to the upside from here could mark the start of price correction to the upside subject to 1.0900 minor resistance which needs to be cleared. On the 4-hour chart, the stochastics has moved up strongly, forming a higher high against the lower high in price which indicates a near term sideways price action between 1.0900 and 1.0850. The bias to the upside can be seen strengthening only on a close above 1.0900, while 1.0850 remains in focus but the downside could be limited for now.
EUR/AUD Daily Analysis

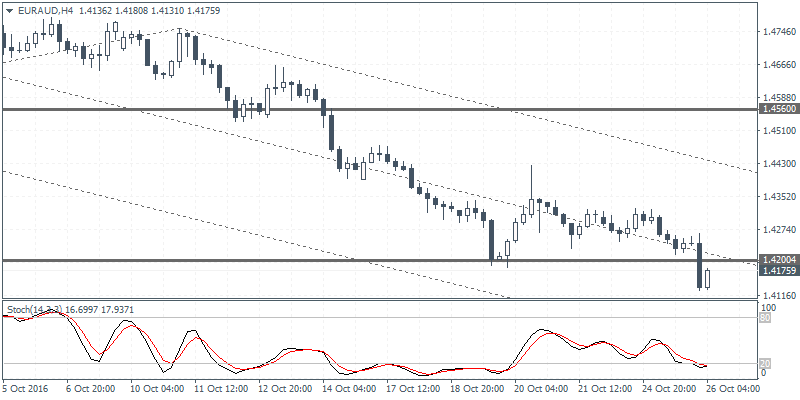
EUR/AUD (1.4175) broke down below the previous low at 1.4200 yesterday, but the 4-hour stochastics is showing a bullish divergence at the current level. A close above 1.4200 could signal near term upside in prices. The short-term corrective move towards 1.4560 marks the retest of the weekly chart's descending triangle pattern as resistance could be established at 1.4560.
