Breaking News
Get 45% Off 0
🌊 NVIDIA ripple effect: Track AI stocks' response to chip giant's earnings
Explore AI Stocks

Highwoods Properties' (HIW) Q3 FFO Beats, Outlook Improved

By Zacks Investment ResearchStock MarketsOct 24, 2017 10:21PM ET
www.investing.com/analysis/article-200221036
Highwoods Properties' (HIW) Q3 FFO Beats, Outlook Improved
By Zacks Investment Research   |  Oct 24, 2017 10:21PM ET
Saved. See Saved Items.
This article has already been saved in your Saved Items
 
 
BXP
+1.37%
Add to/Remove from Watchlist
Add to Watchlist
Add Position

Position added successfully to:

Please name your holdings portfolio
 
VTR
+0.54%
Add to/Remove from Watchlist
Add to Watchlist
Add Position

Position added successfully to:

Please name your holdings portfolio
 
HIW
+0.94%
Add to/Remove from Watchlist
Add to Watchlist
Add Position

Position added successfully to:

Please name your holdings portfolio
 
CONE
+0.00%
Add to/Remove from Watchlist
Add to Watchlist
Add Position

Position added successfully to:

Please name your holdings portfolio
 

Highwoods Properties Inc. (NYSE:HIW) reported third-quarter 2017 funds from operations (FFO) of 86 cents per share, beating the Zacks Consensus Estimate by a penny. It also compares favorably with the year-ago tally of 82 cents.

Results indicate strong leasing metrics and robust growth in straight-line rental income.

Total revenues for the quarter jumped 8.4% year over year to $180 million. In addition, the figure surpassed the Zacks Consensus Estimate of $178 million.

Highwoods Properties, Inc. Price, Consensus and EPS Surprise

Note: The EPS numbers presented in the above chart represent funds from operations (FFO) per share.

Quarter in Detail

Highwoods leased 1.1 million square feet of second-generation office space during the reported quarter. Same-property cash NOI climbed 3.4% year over year.

During the reported quarter, the company sold assets worth $93 million, which included 28.6% share in three joint-venture buildings. Subsequently, contribution to total revenues from joint ventures reduced to 1.5%.

The company also amended its term loan and unsecured revolving credit facility. The credit facility recast upsized Highwoods’ borrowing capacity by 125 million, extended maturity and lowered the borrowing spread by 10 basis points (bps).

As of Sep 30, 2017, Highwoods had $4.9 million of cash and cash equivalents compared with $49.5 million as of Dec 31, 2016.

2017 Outlook

Highwoods narrowed its 2017 FFO per share guidance range to $3.36-$3.38 from the previous range of $3.33-$3.38. The Zacks Consensus Estimate for 2017 is currently pegged at $3.38.

Our Viewpoint

Improving operating performance reflects brighter prospects for the company, going forward. Highwoods is making diligent efforts to expand its footprint in high-growth markets, and enhance the portfolio quality through prudent asset acquisitions and disposals. Furthermore, the company’s dispositions are anticipated to have miniscule impact on its revenues.

Its focus on high-quality office assets in best business districts (BBDs) bode well. With the recovery in the economy and labor markets, Highwoods will likely experience healthy demand for office space.

Nonetheless, Highwoods faces intense competition from developers, owners and operators of office properties, as well as other commercial real estate, including sublease space available from its tenants. This restricts the company’s ability to attract and retain tenants at relatively higher rents than its competitors.

Highwoods currently carries a Zacks Rank #3 (Hold). You can see the complete list of today’s Zacks #1 Rank (Strong Buy) stocks here.

The stock has gained 0.5% year to date, underperforming 2.3% growth registered by the industry it belongs to.


We now look forward to the earnings releases of other real estate investment trusts (REITs) like Ventas, Inc. (NYSE:VTR) , Boston Properties, Inc. (NYSE:BXP) and CyrusOne Inc (NASDAQ:CONE) . While Ventas will release earnings on Oct 27, Boston Properties and CyrusOne are slated to report their numbers on Nov 1 and Oct 26, respectively.

Note: FFO, a widely used metric to gauge the performance of REITs, is obtained after adding depreciation and amortization and other non-cash expenses to net income.

Zacks' Hidden Trades

While we share many recommendations and ideas with the public, certain moves are hidden from everyone but selected members of our portfolio services. Would you like to peek behind the curtain today and view them?

Starting now, for the next month, I invite you to follow all Zacks' private buys and sells in real time from value to momentum...from stocks under $10 to ETF to option movers...from insider trades to companies that are about to report positive earnings surprises (we've called them with 80%+ accuracy). You can even look inside portfolios so exclusive that they are normally closed to new investors.

Click here for Zacks' secret trade>>


Highwoods Properties, Inc. (HIW): Free Stock Analysis Report

Ventas, Inc. (VTR): Free Stock Analysis Report

Boston Properties, Inc. (BXP): Free Stock Analysis Report

CyrusOne Inc (CONE): Free Stock Analysis Report

Original post

Zacks Investment Research

Highwoods Properties' (HIW) Q3 FFO Beats, Outlook Improved
 

Related Articles

Highwoods Properties' (HIW) Q3 FFO Beats, Outlook Improved

Add a Comment

Comment Guidelines

We encourage you to use comments to engage with other users, share your perspective and ask questions of authors and each other. However, in order to maintain the high level of discourse we’ve all come to value and expect, please keep the following criteria in mind:  

  •            Enrich the conversation, don’t trash it.

  •           Stay focused and on track. Only post material that’s relevant to the topic being discussed. 

  •           Be respectful. Even negative opinions can be framed positively and diplomatically. Avoid profanity, slander or personal attacks directed at an author or another user. Racism, sexism and other forms of discrimination will not be tolerated.

  • Use standard writing style. Include punctuation and upper and lower cases. Comments that are written in all caps and contain excessive use of symbols will be removed.
  • NOTE: Spam and/or promotional messages and comments containing links will be removed. Phone numbers, email addresses, links to personal or business websites, Skype/Telegram/WhatsApp etc. addresses (including links to groups) will also be removed; self-promotional material or business-related solicitations or PR (ie, contact me for signals/advice etc.), and/or any other comment that contains personal contact specifcs or advertising will be removed as well. In addition, any of the above-mentioned violations may result in suspension of your account.
  • Doxxing. We do not allow any sharing of private or personal contact or other information about any individual or organization. This will result in immediate suspension of the commentor and his or her account.
  • Don’t monopolize the conversation. We appreciate passion and conviction, but we also strongly believe in giving everyone a chance to air their point of view. Therefore, in addition to civil interaction, we expect commenters to offer their opinions succinctly and thoughtfully, but not so repeatedly that others are annoyed or offended. If we receive complaints about individuals who take over a thread or forum, we reserve the right to ban them from the site, without recourse.
  • Only English comments will be allowed.
  • Any comment you publish, together with your investing.com profile, will be public on investing.com and may be indexed and available through third party search engines, such as Google.

Perpetrators of spam or abuse will be deleted from the site and prohibited from future registration at Investing.com’s discretion.

Write your thoughts here
 
Are you sure you want to delete this chart?
 
Post
Post also to:
 
Replace the attached chart with a new chart ?
1000
Your ability to comment is currently suspended due to negative user reports. Your status will be reviewed by our moderators.
Please wait a minute before you try to comment again.
Thanks for your comment. Please note that all comments are pending until approved by our moderators. It may therefore take some time before it appears on our website.
 
Are you sure you want to delete this chart?
 
Post
 
Replace the attached chart with a new chart ?
1000
Your ability to comment is currently suspended due to negative user reports. Your status will be reviewed by our moderators.
Please wait a minute before you try to comment again.
Add Chart to Comment
Confirm Block

Are you sure you want to block %USER_NAME%?

By doing so, you and %USER_NAME% will not be able to see any of each other's Investing.com's posts.

%USER_NAME% was successfully added to your Block List

Since you’ve just unblocked this person, you must wait 48 hours before renewing the block.

Report this comment

I feel that this comment is:

Comment flagged

Thank You!

Your report has been sent to our moderators for review
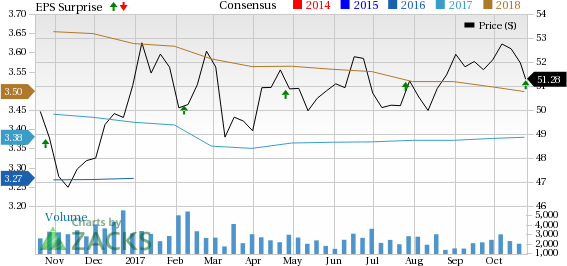
Continue with Apple
Continue with Google
or
Sign up with Email