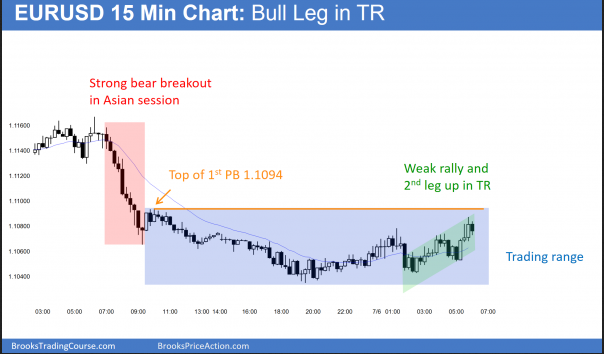
The 15 minute EUR/USD Forex chart shows the selloff in the Asian session and the 10 hour trading range. The rally of the past 6 hours is testing the top of the 1st pullback. It is a nested 2 legged rally, and legs within trading ranges usually have 2 legs. This is probably near the top of the range. Hence, the upside is probably limited today.
The daily chart of the EUR/USD Forex market had an outside down day yesterday. Furthermore, its high was at the daily moving average and at the top of the 240 minute trading range. I have been writing since the June 24 sell climax that the bulls would probably have a 1 – 3 week rally. They have met the minimum goal.
Since a trading range usually follows a sell climax, the odds are that the EUR/USD will go sideways to down to test the 1.1000 area. That is the low of the 1st inside day after the sell climax. Furthermore, since traders expect a trading range, it is an area where bears will take profits and bulls will buy again.
Bear flag on daily chart
While it is possible that the EUR/USD Forex chart can break strongly below the bear flag, the odds are against it. The follow-through after the sell climax has been bad, and the sell climax came late in a bear trend. It is therefore more likely an exhaustive end of the trend than a breakout.
Exhaustion usually creates a trading range. If the daily chart goes sideways for 20 or more bars, the bears once again might be willing to sell for a swing trade. At the moment, they are more likely only willing to scalp. This is because they correctly believe that the chart is now in a trading range.
Overnight EUR/USD Forex price action
The EUR/USD fell sharply for a couple of hours in Asia, and was in a 50 pip trading range since then. The magnet is the 1.1094 top of the 1st pullback from the bear breakout. It rally of the last hour came to within 7 pips. This might be close enough to adequately test the high. However, the rally could easily go a little further before turning down and forming a trading range on the 5 minute chart. Less likely, the bulls will reverse the overnight selloff with a strong bull breakout.
The 10 hour rally on the 5 minute chart had deep pullbacks. The bars mostly overlapped and had big tails on top. It was therefore more likely a rally within a trading range than in an early bull trend. Hence, day traders expect more trading range price action. They will mostly scalp and many will enter with limit orders and scale in.

