
A thin market doesn’t necessarily mean a quiet market – on the contrary, rates were unusually volatile yesterday in part because of the Thanksgiving holiday in the US. As a result, the dollar’s performance was unusually wide yesterday, ranging from +0.95% vs NZD to -0.50% vs SEK. It was higher against the CAD, JPY and AUD as well but down vs the EUR, CHF, GBP and NOK. The commodity currencies continue to weaken along with commodities themselves. NZD’s performance was particularly puzzling, as it came after New Zealand business confidence rose to a near 15-year high and the money markets have increased the odds of a January interest rate hike in NZ to around 40%. Apparently it is being dragged down by weakness in AUD. Similarly, the strong rally in SEK following the weaker-than-expected retail sales in October was surprising as well. That may have been in anticipation of a strong Q3 GDP figure today; the market is looking for +0.5% qoq, a turnaround from -0.2% qoq in Q2. GBP strengthened after the Bank of England surprised the markets by saying it would end mortgage incentives for banks under its Funding for Lending Scheme in order to slow rising UK house prices. This was perceived as a hawkish move – maybe one that presages further moves to rein in credit growth? My take would be different: the move suggests that the Bank won’t have to raise rates to quell any housing bubble and so it will allow them to keep rates lower for longer, which should be GBP-bearish. Note that NZD fell back on Aug. 20th when the RBNZ instituted restrictions on mortgage lending in an effort to cool the housing market there.
The EUR/JPY and USD/JPY continue to move higher; the usual end-of-month deluge of data from Japan had no influence on the market even though core inflation (excluding food and energy) moved back above zero for the first time in five years, which might indicate that the Bank of Japan is beginning to have some success in creating inflation.
Speaking of UK house prices, the European morning started with the UK Nationwide house price index, which rose by the expected 0.6% mom in November, a slowdown from +1.0% in October. Later in the day, UK mortgage approvals for October are estimated at 68.5k, up from 66.7k.
The key indicator of the day is the preliminary Eurozone inflation data for November. It was the sudden fall in inflation last month that triggered the ECB’s surprise cut in interest rates at their November meeting. The market is expecting a small rebound in the headline CPI figure to +0.8% yoy from +0.7% yoy in October. The preliminary core rate is also forecast to slightly accelerate to 0.9% yoy from +0.8% yoy. After Thursday’s greater-than-expected acceleration in German inflation to +1.6% yoy from +1.2%, anything else would be a serious surprise. Higher Eurozone inflation will take some pressure off the ECB to cut rates and therefore is likely to support EUR/USD. The Eurozone’s unemployment rate is expected to have remained at 12.2% in October. Elsewhere in Europe, German retail sales for October unexpectedly fell 0.8% mom, whereas they had been expected to rise +0.5%. The news had no immediate impact on EUR/USD.
Canada publishes its GDP data for September. The mom release is estimated to show a rise of 0.2%, a deceleration from +0.3% in August. On the other hand, the yoy rate is expected to rise to 2.1% from 2.0%.
We have only one speaker today. ECB’s Mersch gives a keynote speech on Financial Market policy at a conference.
The Market
EUR/USD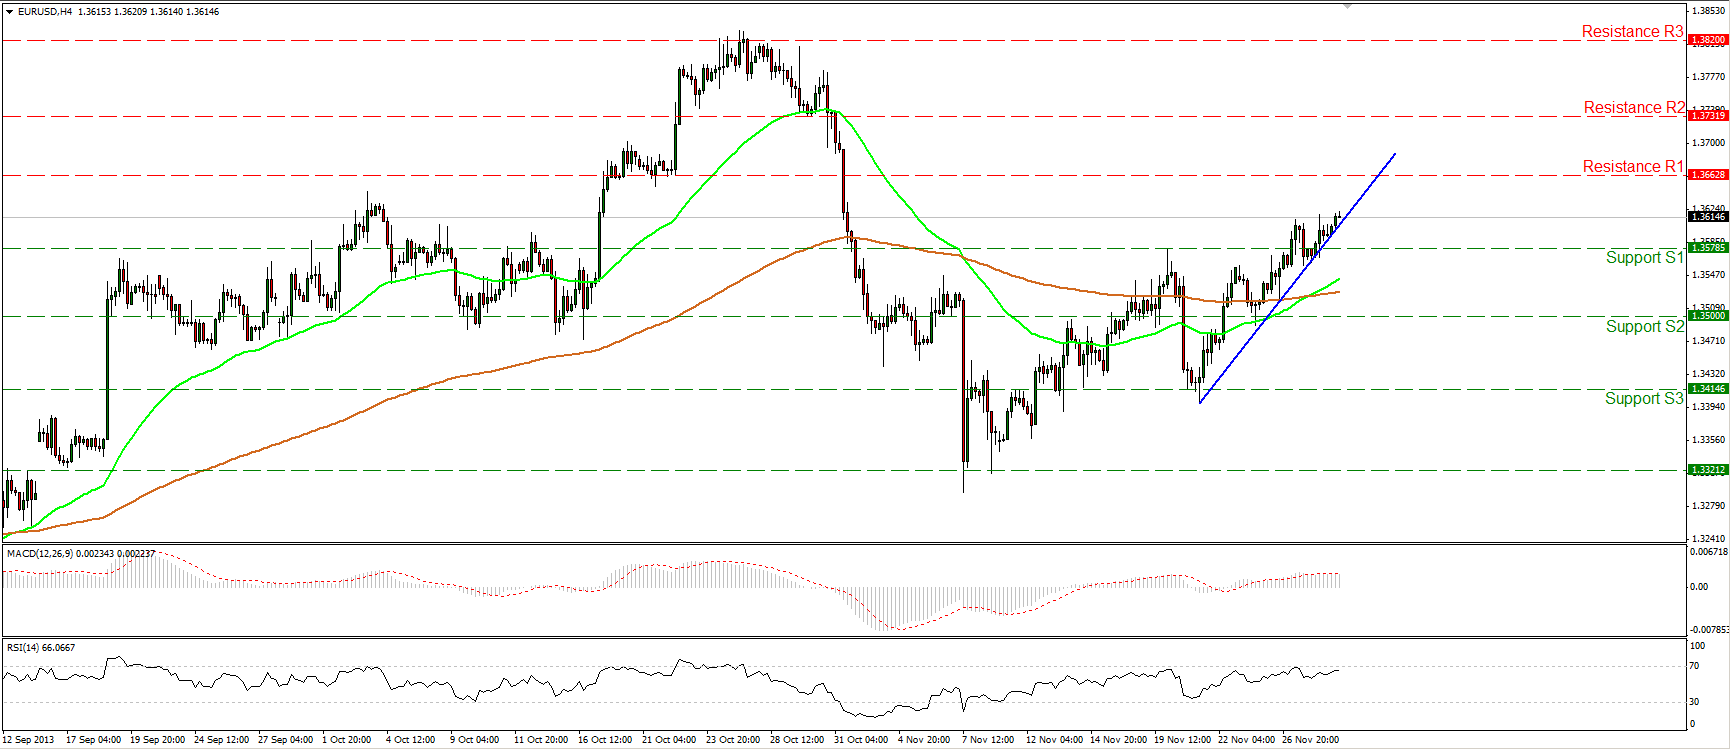 EUR/USD Hourly Chart" title="EUR/USD Hourly Chart" width="1731" height="751">
The EUR/USD moved higher, riding the short-term blue trend line. As trading starts in Europe the pair is heading towards the resistance of 1.3662 (R1). The trend remains an uptrend as indicated by the blue trend line and the bullish cross of the moving averages. On the daily chart the 14-days MACD oscillator lies above its trigger line and managed to enter is bullish territory, confirming the positive picture of the pair.
• Support: 1.3578 (S1), 1.3500 (S2), 1.3414 (S3)
• Resistance: 1.3662 (R1), 1.3731 (R2), 1.3820 (R3).
USD/JPY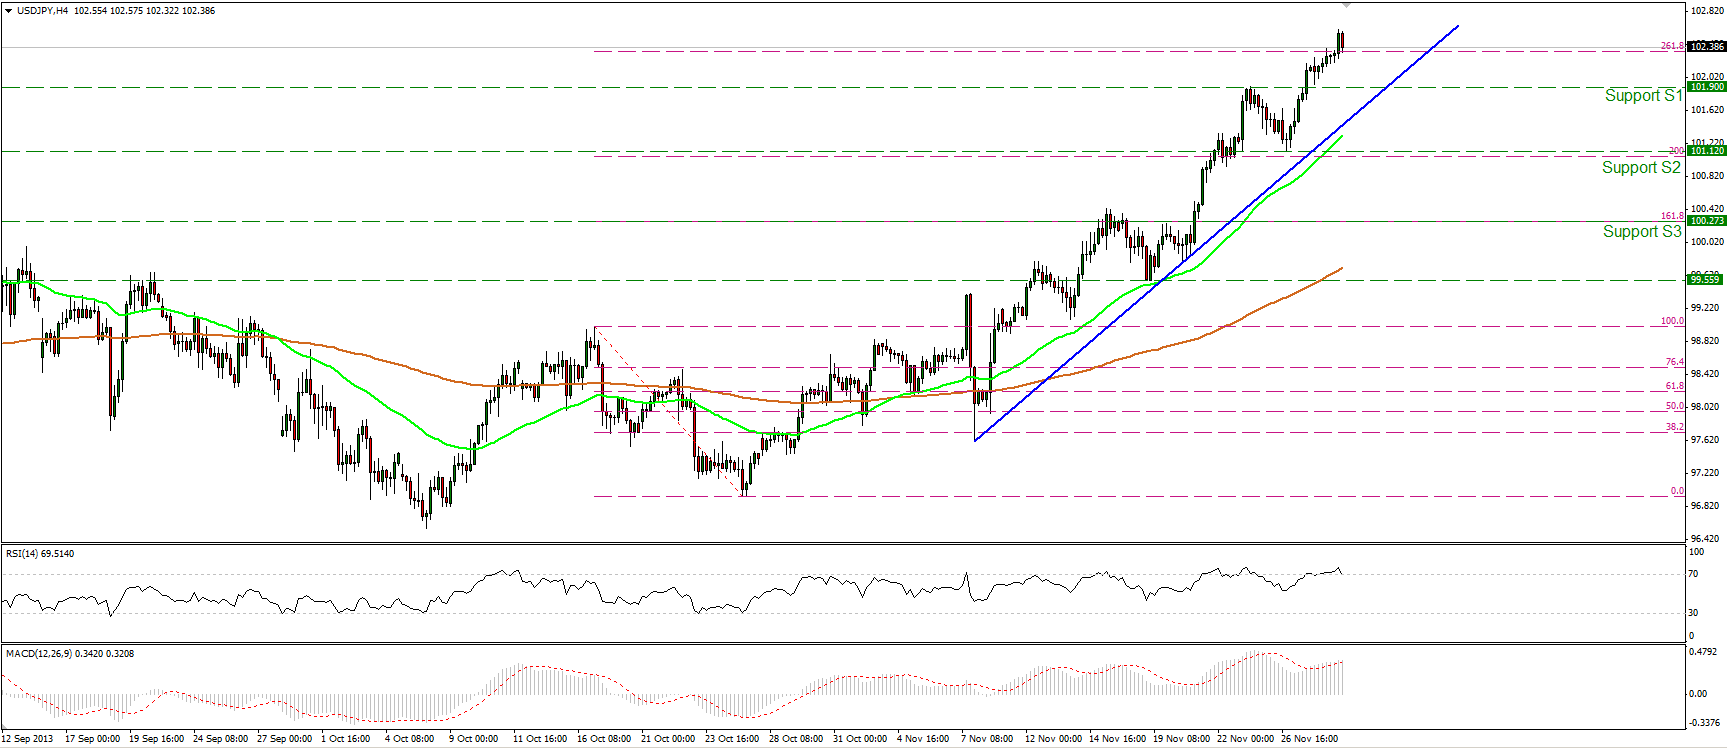 USD/JPY Hourly Chart" title="USD/JPY Hourly Chart" width="1731" height="751">
The USD/JPY moved higher and reached the 261.8% Fibonacci extension level of the 17th-25th Oct. downward wave. The bias remains to the upside, since the rate is trading above the uptrend line and above both moving averages. However the RSI seems ready to exit its overbought zone, thus I would expect a pullback towards the 101.90 (S1) support barrier before the bulls prevail again. On the daily and weekly charts, the subsequent move upon the completion of the symmetrical triangle is still in progress.
• Support: 101.90 (S1), 101.12 (S2), 100.27 (S3).
• Resistance: 103.60 (R1), 105.24 (R2), 106.85 (R3).
EUR/GBP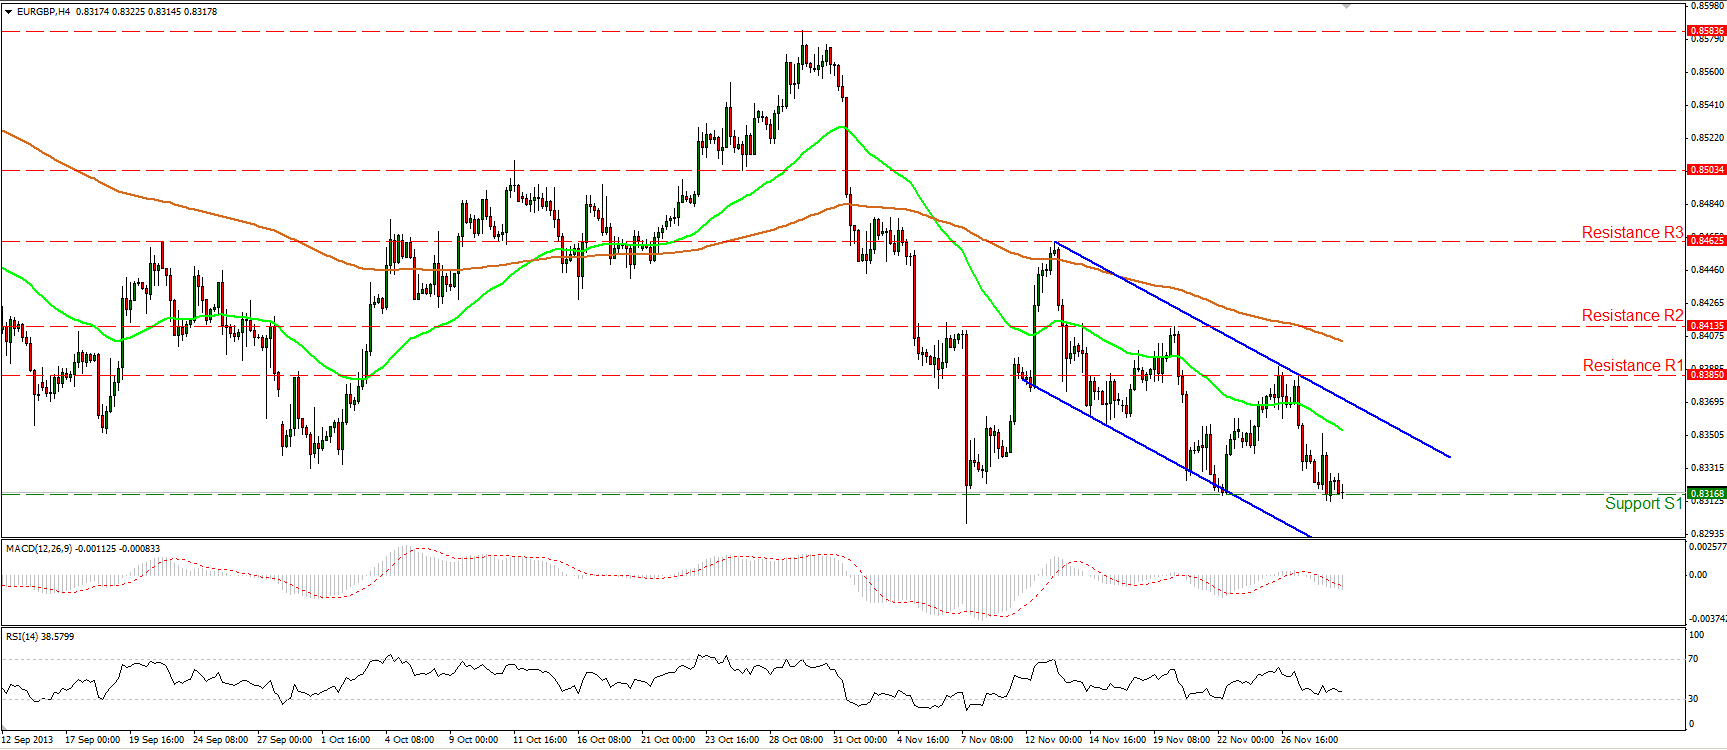 EUR/GBP Hourly Chart" title="EUR/GBP Hourly Chart" width="1731" height="751">
The EUR/GBP moved lower yesterday reaching the 0.8316 (S1) support level. Currently the pair is testing that barrier and a clear downward violation would have larger bearish implications. If the break occurs I would expect extensions towards the 161.8% Fibonacci extension level of the 7th -13th Nov. upward wave. The short-term trend is a downtrend, since the price is printing lower highs and lower lows within the blue downward sloping channel and the 50-period moving average lies below the 200-period moving average.
• Support: 0.8316 (S1), 0.8263 (S2), 0.8221 (S3).
• Resistance: 0.8385 (R1), 0.8413 (R2), 0.8462 (R3).
Gold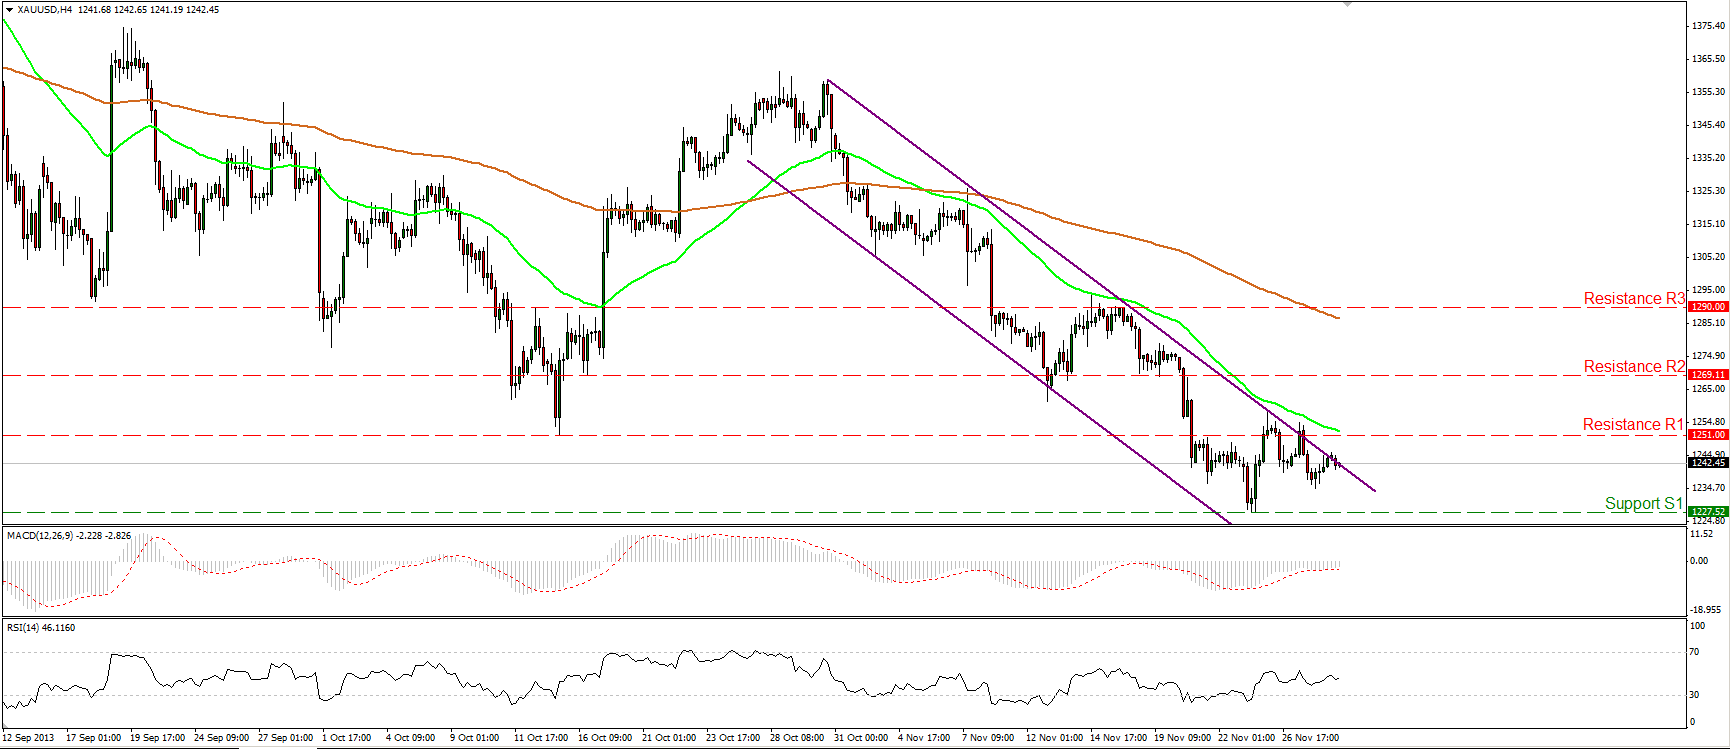 XAU/USD Hourly Chart" title="XAU/USD Hourly Chart" width="1731" height="751">
Gold moved slightly higher to test once more the upper boundary of the downward sloping channel. As long as the yellow metal is trading within the channel, the short-term direction is still downward. On the daily chart the price is trading slightly above the neckline of a possible head and shoulders top formation, where a downward break would have larger bearish implications.
• Support: 1227(S1), 1211 (S2), 1177 (S3).
• Resistance: 1251 (R1), 1269 (R2), 1290 (R3).
Oil
WTI remained at the levels we left it yesterday. However, since the bears managed to overcome the strong hurdle of 93.14 (R1) on Wednesday, I would expect them to regain momentum and drive the battle towards the support of 91.20 (S1). WTI lies within the longer-term downward sloping channel, while the bearish cross of the moving averages remains in effect since the 23rd of September.
• Support: 91.20 (S1), 87.85 (S2), 84.00 (S3).
• Resistance: 93.14 (R1), 95.36 (R2), 98.81 (R3).
BENCHMARK CURRENCY RATES - DAILY GAINERS AND LOSERS
MARKETS SUMMARY
Disclaimer: This information is not considered as investment advice or investment recommendation but instead a marketing communication. This material has not been prepared in accordance with legal requirements designed to promote the independence of investment research, and that it is not subject to any prohibition on dealing ahead of the dissemination of investment research. IronFX may act as principal (i.e. the counterparty) when executing clients’ orders.
This material is just the personal opinion of the author(s) and client’s investment objective and risks tolerance have not been considered. IronFX is not responsible for any loss arising from any information herein contained. Past performance does not guarantee or predict any future performance. Redistribution of this material is strictly prohibited. Risk Warning: Forex and CFDs are leveraged products and involves a high level of risk. It is possible to lose all your capital. These products may not be suitable for everyone and you should ensure that you understand the risks involved. Seek independent advice if necessary. IronFx Financial Services Limited is authorised and regulated by CySEC (Licence no. 125/10). IronFX UK Limited is authorised and regulated by FCA (Registration no. 585561). IronFX (Australia) Pty Ltd is authorized and regulated by ASIC (AFSL no. 417482)