


Sign up to create alerts for Instruments,
Economic Events and content by followed authors
Free Sign Up Already have an account? Sign In
Please try another search

Lennar Corporation (NYSE:LEN) surpassed expectations on both counts for the sixth time in a row.
The company’s second-quarter fiscal 2017 adjusted earnings of 91 cents per share surpassed the Zacks Consensus Estimate of 78 cents by 16.7%. Earnings decreased 4.2% from the year-ago level of 95 cents.
Expenses related to Lennar’s acquisition of WCI Communities, Inc. hurt its second-quarter earnings.
Total revenue of $3.26 billion beat the Zacks Consensus Estimate of $2.89 billion by almost 12.8%. Revenues also grew 18.8% year over year as the homebuilding, financial services, Rialto and multi-family segments performed significantly well.
Segment Details
Homebuilding : Segment revenues increased 17.7% year over year to $2.89 billion driven by higher number of homes delivered. Within this, home sales constituted $2.87 billion (up 18.1% year over year) and land sales accounted for $15.4 million (down 27.8%).
New home orders increased 12% year over year to 8,898 in the fiscal second quarter. The potential value of net orders increased 17% year over year to $3.4 billion.
Home deliveries were up 15% year over year to 7,710, buoyed by higher number of homes delivered across all homebuilding segments.
The average selling price (ASP) of homes delivered was $374,000, increasing 3.3% year over year.
In the quarter under review, backlog grew 13% year over year to 10,201 homes. Potential housing revenues from backlog increased 20% year over year to $4 billion.
The company increased sales incentives during the quarter. Lennar’s sales incentives comprised 5.7% of home sales revenues in the fiscal second quarter, flat year over year but down 20 basis points sequentially.
Margins
Gross margin on home sales declined 160 bps to 21.5% owing to rising land and construction costs. However, it improved 40 basis points sequentially.
As a percentage of sales, SG&A expenses remained flat at 9.3%.
Financial Services: Financial Services revenues increased 18.4% to $208.4 million in the quarter. Operating earnings at the segment were $43.7 million, down from $44.1 million a year ago.
Rialto Investments: Rialto Investments’ revenues of $68 million increased 51.6% year over year.
The segment reported operating loss of $6.4 million in the quarter compared with $18.1 million loss a year ago.
Lennar Multi-Family: Lennar Multi-Family revenues of $99.8 million increased 34.6% in the reported quarter from $74.2 million in the prior-year quarter.
The segment’s operating income was $6.5 million in the second quarter against $14.9 million in the year-ago quarter.
Financials
Lennar Homebuilding’s cash and cash equivalents totaled $747.7 million as of May 31, 2017, up from $1,050.2 million as of Nov 30, 2016. Net Lennar Homebuilding debt was $5.02 billion as of May 31, 2017 compared with $3.53 billion as of Nov 30, 2016.
Zacks Rank & Other Key Picks
Lennar currently carries a Zacks Rank #2 (Buy).
Other favorably ranked stocks in the construction sector include Lyon William Homes (NYSE:WLH) , M/I Homes, Inc. (NYSE:MHO) and KB Home (NYSE:KBH) .
M/I Homes sports a Zacks Rank #1 (Strong Buy) and is likely to witness a 36.2% rise in earnings. You can see the complete list of today’s Zacks #1 Rank stocks here.
Lyon William, a Zacks Rank #2 stock, is expected to exhibit 38.4% growth in 2017 earnings.
KB Home, also a Zacks Rank #2 stock, is expected to witness 43.3% growth in fiscal 2017 earnings.
Lennar Corporation Price, Consensus and EPS Surprise
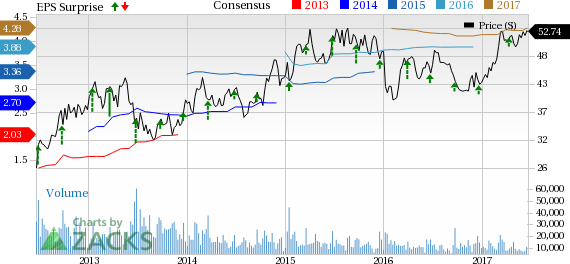
Lennar Corporation Price, Consensus and EPS Surprise | Lennar Corporation Quote
Looking for Stocks with Skyrocketing Upside?
Zacks has just released a Special Report on the booming investment opportunities of legal marijuana.
Ignited by new referendums and legislation, this industry is expected to blast from an already robust $6.7 billion to $20.2 billion in 2021. Early investors stand to make a killing, but you have to be ready to act and know just where to look. See the pot trades we're targeting>>
The Q4 2024 earnings season tapers off from here, with S&P 500® EPS growth surpassing 17%, the highest in 3 years Large cap outlier earnings dates this week include:...
Shares of Alibaba (NYSE:BABA) are on a tear to start off 2025. The consumer discretionary and tech stock is up by 52% this year as of the Feb. 25 close. The company’s cloud...
Every investor should know the term CEP, or customer engagement platform, because it is central to businesses' use of AI. CEPs provide software services to connect and communicate...
Are you sure you want to block %USER_NAME%?
By doing so, you and %USER_NAME% will not be able to see any of each other's Investing.com's posts.
%USER_NAME% was successfully added to your Block List
Since you’ve just unblocked this person, you must wait 48 hours before renewing the block.
I feel that this comment is:
Thank You!
Your report has been sent to our moderators for review
Add a Comment
We encourage you to use comments to engage with other users, share your perspective and ask questions of authors and each other. However, in order to maintain the high level of discourse we’ve all come to value and expect, please keep the following criteria in mind:
Enrich the conversation, don’t trash it.
Stay focused and on track. Only post material that’s relevant to the topic being discussed.
Be respectful. Even negative opinions can be framed positively and diplomatically. Avoid profanity, slander or personal attacks directed at an author or another user. Racism, sexism and other forms of discrimination will not be tolerated.
Perpetrators of spam or abuse will be deleted from the site and prohibited from future registration at Investing.com’s discretion.