Are we finally going to see the correlation between stocks and oil soften?
In overnight trade, it was the same 'ol, same 'ol. Crude and stock index futures moved together in lockstep; we saw the same action in early day session trade. Yet, after the Fed meeting, each market seems to be willing to have it's own reaction to the Fed news. Crude oil squeezed, and held, well into positive territory while the stock market remained under moderate pressure. This probably isn't an immediate game changer, but it is a step in the right direction and is worth noting. Both assets trading as one isn't healthy for the financial markets, or the commodity markets. In fact, it should eventually be bullish for stocks...after all, they've taken a hit at the hands of the crude oil futures slide.
The big news of the day was the Fed meeting. The meeting itself was considered to be "dead" going in. This means that few (nobody) believed there was a chance for a policy change, but traders were hoping for hints regarding the pace of upcoming interest rate hikes. In a nutshell, they were very careful to leave a rate hike in March as a possibility, while simultaneously noting softening conditions that probably won't warrant another immediate tightening of credit. In the end, the news was relatively neutral to slightly bearish for stocks, but seems to have been enough to throw cold water on market volatility, which is a blessing in itself.
Treasury Futures Markets

Bonds and notes found support after Fed meeting
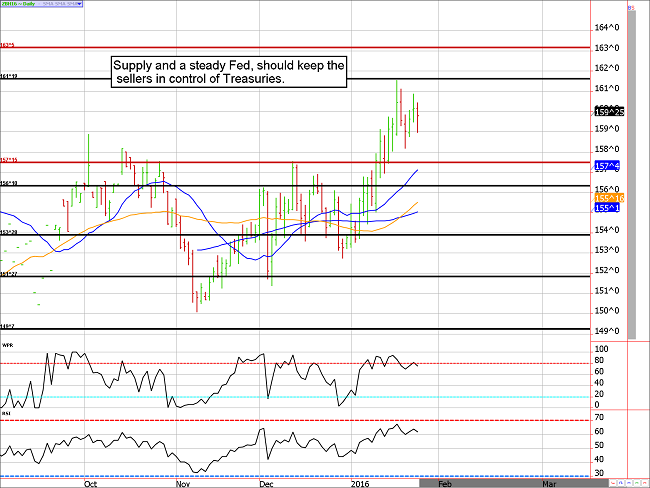
We are a little surprised at the lack of selling in Treasuries. Prior to the Fed meeting, bonds and notes were down moderately, but in post Fed trade they had squared most of the losses. In our view, the Fed was a little more hawkish than most were expecting which should have lured more selling in bonds and notes, but that wasn't the case. After all, in light of the Chinese market collapse and last week's soft patch of data, it would have been easy for the Fed to have at least removed the possibility of a March hike altogether....but they failed to take the opportunity.
From a technical standpoint, the market is forming a pennant pattern. If the bears are going to win this battle, we need to see a break below the mid 158s in the ZB. Likewise, a break above 161 could mark trouble for the bears and victory for the bulls. We are cautiously leaning lower for now.
Treasury Futures Market Analysis
**Bond Futures Market Consensus:** Barring any calamity in stocks, the path of least resistance should be lower for Treasuries in the coming week or two.
**Technical Support:** ZB : 157'14, 155'26, 152'30, 151'11, and 150'10 ZN: 126'31, 126'10, 125'15 and 124'16
**Technical Resistance:** ZB : 161'19 and 163 ZN: 129'01, and 129'28
Stock Index Futures
The Fed didn't deliver, but they didn't completely drop the ball either
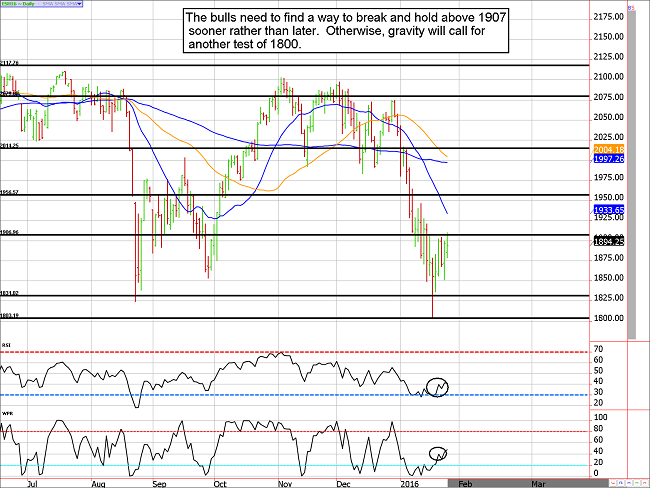
The market has proven it doesn't pay to marry a position. Swing traders are likely faring well in this range bound trade, but position traders are likely having a rough go at things. Despite the nasty bloodshed on stock market quote boards today, the market has been making higher highs and lower lows since last Wednesday's dramatic plunge.
We were hoping the Fed would ease investor concerns enough to push prices above 1906 for good, but a move to the noted level was short-lived. Back into the trading range we go, leaving earnings reports as the only hope for the bulls to break-out in the foreseeable future. If prices can't get above 1907 soon, we'll likely succumb to a retest of the 1800 lows, and maybe even 1770....but we'd prefer not to see it.
Stock Index Futures Market Ideas
**e-mini S&P Futures Market Consensus:** 1906 resistance has held better than we thought it would, but lower lows gives the bulls some hope. We are cautiously leaning higher, but the bulls need to get something going soon to avoid another sweeping sell-off.
**Technical Support:** 1831, 1803, and 1775
**Technical Resistance:** 1906, 1947, 1979
e-mini S&P Futures Day Trading Ideas
**These are counter-trend entry ideas, the more distant the level the more reliable but the less likely to get filled**
ES Day Trade Sell Levels: 1891 (minor), 1902, 1910 and 1918
ES Day Trade Buy Levels: 1865, 1849, 1836, and 1816
In other commodity futures and options markets....
November 24 - Roll long December corn into March to avoid delivery.
January 7 - Sell April crude oil 26.00 puts near 41 cents ($410).
January 8 - Sell Feb e-mini S&P 500 1700 puts for about 8.00 to 8.50 ($400 to $425).
January 14 - Sell March 10-year note 129.50 calls for about 19 ticks, or $300.
January 20 - Roll the Feb 1700 put into a March 1600 put for even money to lower risk and margin.
January 20 - Roll the April crude oil 26 put into the May 23 put to lower risk and margin.
Due to time constraints and our fiduciary duty to put clients first, the charts provided in this newsletter may not reflect the current session data.
Seasonality is already factored into current prices, any references to such does not indicate future market action.
NOTE: There is a substantial risk of loss in trading futures and options. Past performance is not indicative of future results. The information and data contained on DeCarleyTrading.com was obtained from sources considered reliable. Their accuracy or completeness is not guaranteed. Information provided on this website is not to be deemed as an offer or solicitation with respect to the sale or purchase of any securities or commodities. Any decision to purchase or sell as a result of the opinions expressed on DeCarleyTrading.com will be the full responsibility of the person authorizing such transaction.
There is substantial risk of loss in trading futures and options.
