Along with his weekly report, Marvin Appel reveals a potential major market reversal based on a proprietary bottom fishing indicator utilizing MACD to detect oversold market conditions.
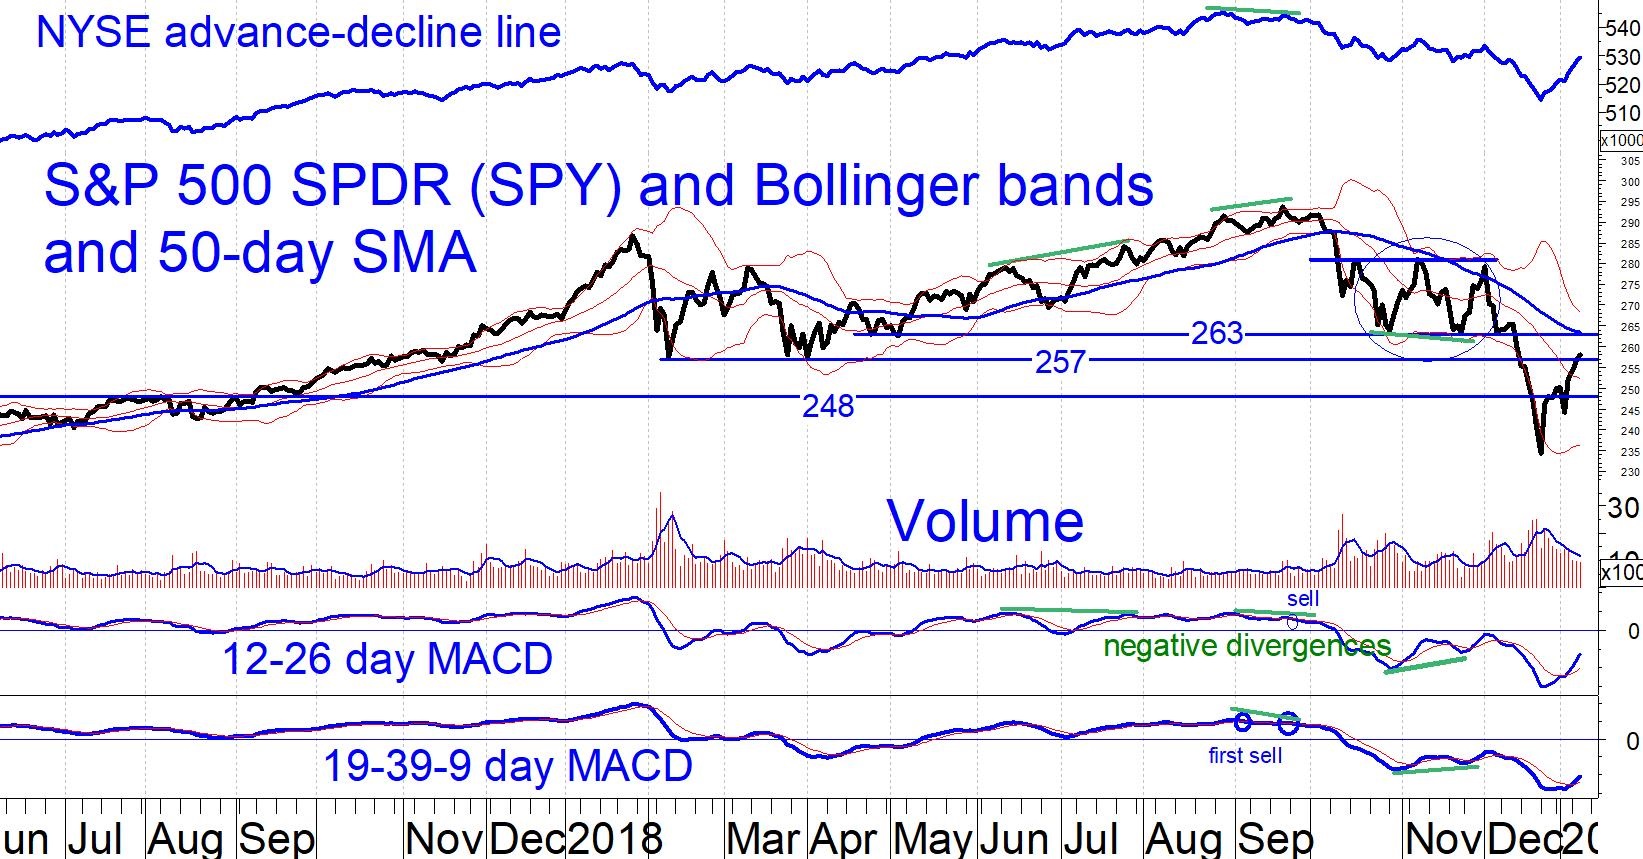
State of the market: Our major term reversal indicator gave a buy signal on Jan. 4, its first since 2011 (explained in detail below). This MACD-based indicator shows that the market is beginning to recover from very oversold conditions. It has an excellent record of spotting market bottoms. The buy signal makes it likely that 2019 will be profitable for stocks, although nearer-term prospects remain uncertain. Our main U.S. equity timing model, which unfortunately experienced a record drawdown during the fourth quarter of 2018, remains on a sell signal. It could move to “hold” as early as Jan. 14.The S&P 500 SPDR (SPY (NYSE:SPY)) hit a low of 234 on Dec. 24 and has since rallied more than 9%. Potential resistance lies in the 257-263 area (see chart below). Using the 2011 correction as a guide, we could see a several-percent retracement at some point during the first quarter even if stocks are destined to enjoy a good year— as they did following the Oct. 3, 2011 correction low.
I remain cautious about stocks. Unlike corrections of similar magnitude that occurred in 2011, 1998 or 1990, we are not in the midst of an economic boom like the 1990s, and the Federal Reserve will not pull a rabbit out of its hat with quantitative easing the way it did in 2011. The question is whether we are headed for a recession. Last month the bond market was telling us yes. Corporate bond prices were falling, spreads to Treasuries were rising and the yield curve was flattening.
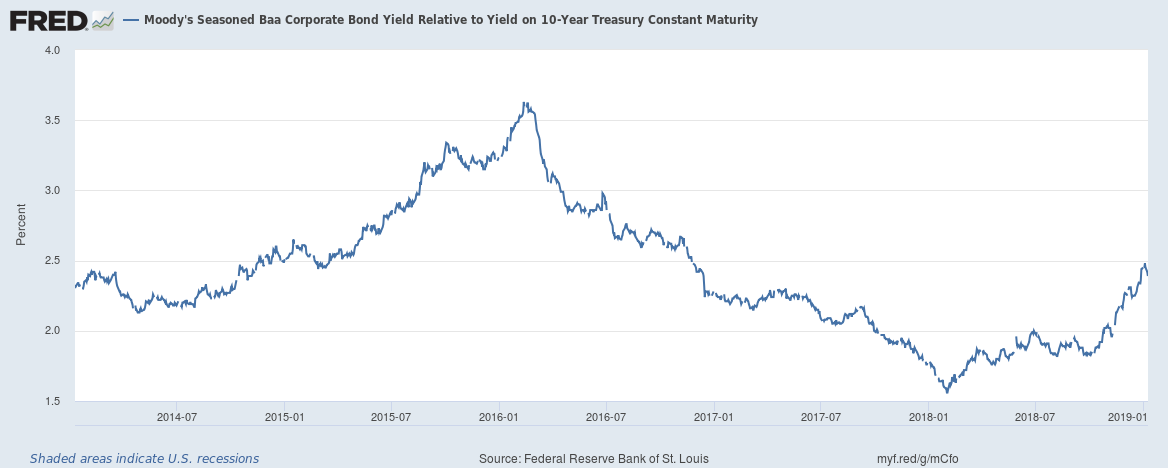
As an example, the chart below shows the yield spread from lower-investment-grade corporate bonds (Baa) and Treasuries. The wider the spread the greater payment the market demands for taking credit risk. Now at 2.4%, this spread is at its highest in two years. High yield bond spreads show a similar pattern, and are likewise at two-year highs even after the recent sharp recovery in high yield bond prices.
However, all of these potential warning signs have reversed themselves in recent days. If there is no imminent recession then high yield and floating rate funds, now yielding more than at any time since mid-2016, could be attractive alternatives to equity exposure, especially on a risk-adjusted basis. On the other hand, if there is to be a recession then neither equities nor riskier corporate bonds are attractive. We will have to follow the markets’ lead on this question. Either way, I believe that the time for exuberance about equities has passed.
Major Reversal Indicator is Flashing “BUY”
Back in 2002 I developed an indicator designed to identify major market bottoms based on analyzing the S&P 500 Index price data going back to 1941. As you will see below, this indicator has been quite successful over many years. On Jan. 4, 2019 this indicator flashed an entry for the first time since September 2011. More aggressive investors can use this as a bottom-fishing opportunity.
History of the Major Term Reversal Indicator
The indicator uses MACD to detect oversold market conditions that potentially represent important market bottoms. It generates entries only after significant market corrections or bear markets in the S&P 500 Index (not including dividends). There have been only 23 entries since the start of 1942.
The chart below shows all the entry signals since 1942 (blue vertical lines). Most occurred very close to major market bottoms. Note, however, that during severe bear markets such as 1973-1974, 2000-2003 and 2007-2009 there were entries that turned out to be very premature.

The table below lists the 22 trades that have occurred and reports how the market behaved 13, 26 and 52 weeks after each entry. There is no formal sell signal with this indicator.
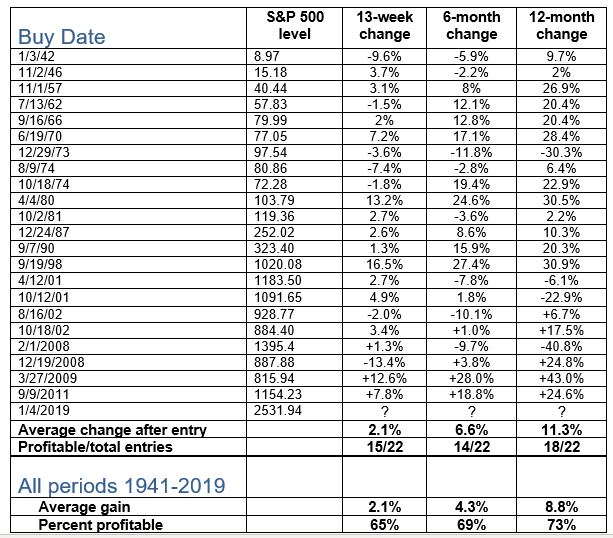
ImplicationOf course, past results do not guarantee any future behavior. With that caveat in mind, history seems to suggest that entry signals have been very successful except during early stages of what, in hindsight, turned out to be severe bear markets. That suggests that how you interpret the Jan. 4 entry depends on whether you think we are at the start of a major bear market analogous to 2007-2009, 2000-2003 or 1973-1974.
Although government and corporate debt levels are extremely high, I do not believe that we are on the precipice of a major bear market. On the other hand, I do not expect the sort of market rally we saw after the September 2011 entry because back then, the Fed bailed out stocks with new rounds of quantitative easing. There will be no such intervention this time around. The entry signal is good news for equities in 2019, but does not rule out continued market volatility or a retest of the Dec. 26 lows. In particular, the first three months following entries have been no more profitable than average. As a result, investors should remain cautious but optimistic.