Cup-&-handle patterns are bullish formations that take place in bull markets.
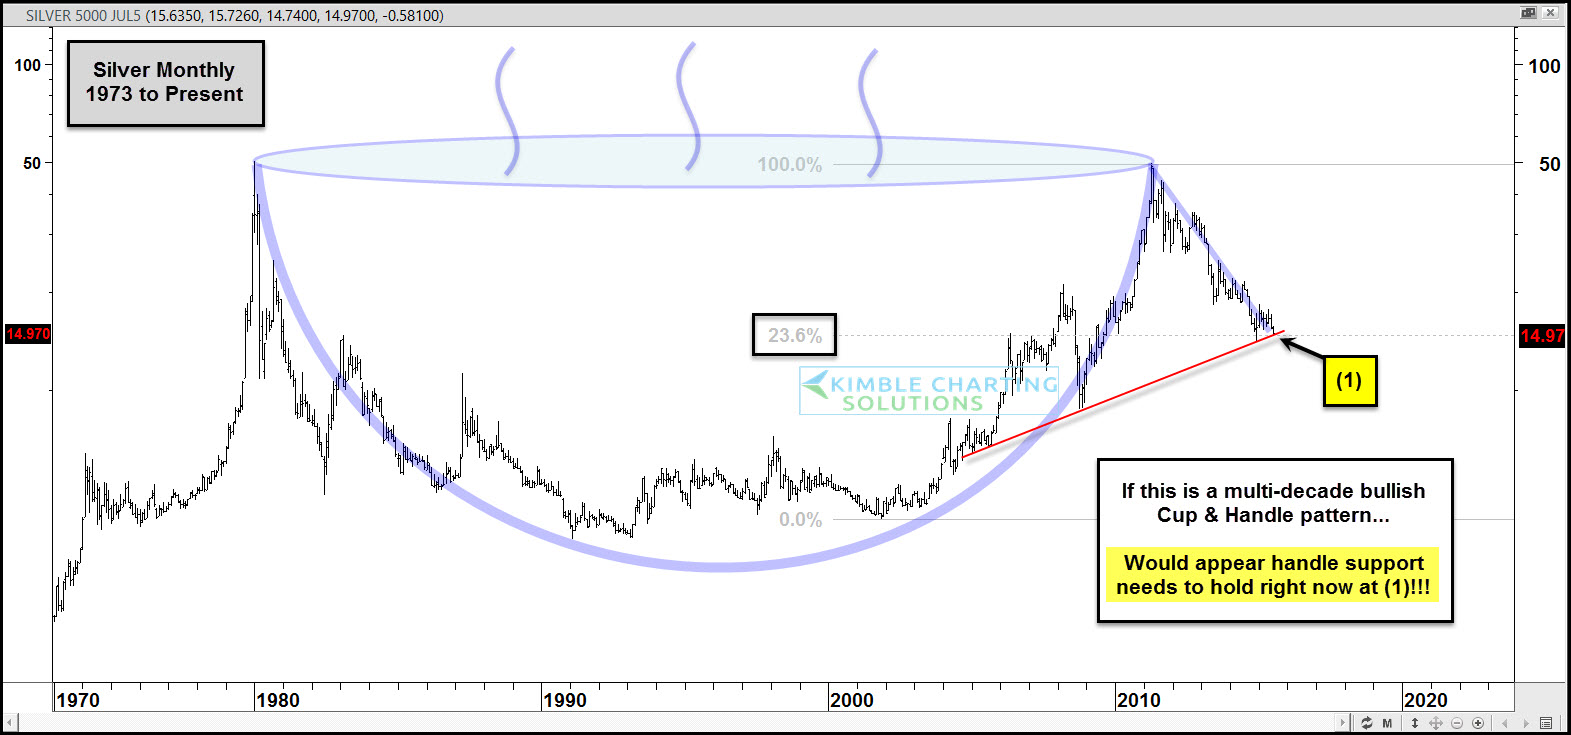
Is silver creating a huge multi-decade bullish cup-&-handle pattern, even though its lost 65% of its value in the last 4-years?
The chart below looks at silver from 1973 to present.
As mentioned earlier, its been an ugly 4 years for silver, as its lost two-thirds of its value, since creating a potential double top back in 2011.
With silver down 65%, is it a stretch to say that silver is still in an uptrend, where cup-&-handle patterns historically take place?
Yes!
If the pattern would happen to be forming the handle, it would appear an almost “must” hold is in play at (1) above. Silver is now at its 23% Fibonacci level of the 10-year rally off the 2001 lows and 2011 highs and a 10-year support line is also in play right now.
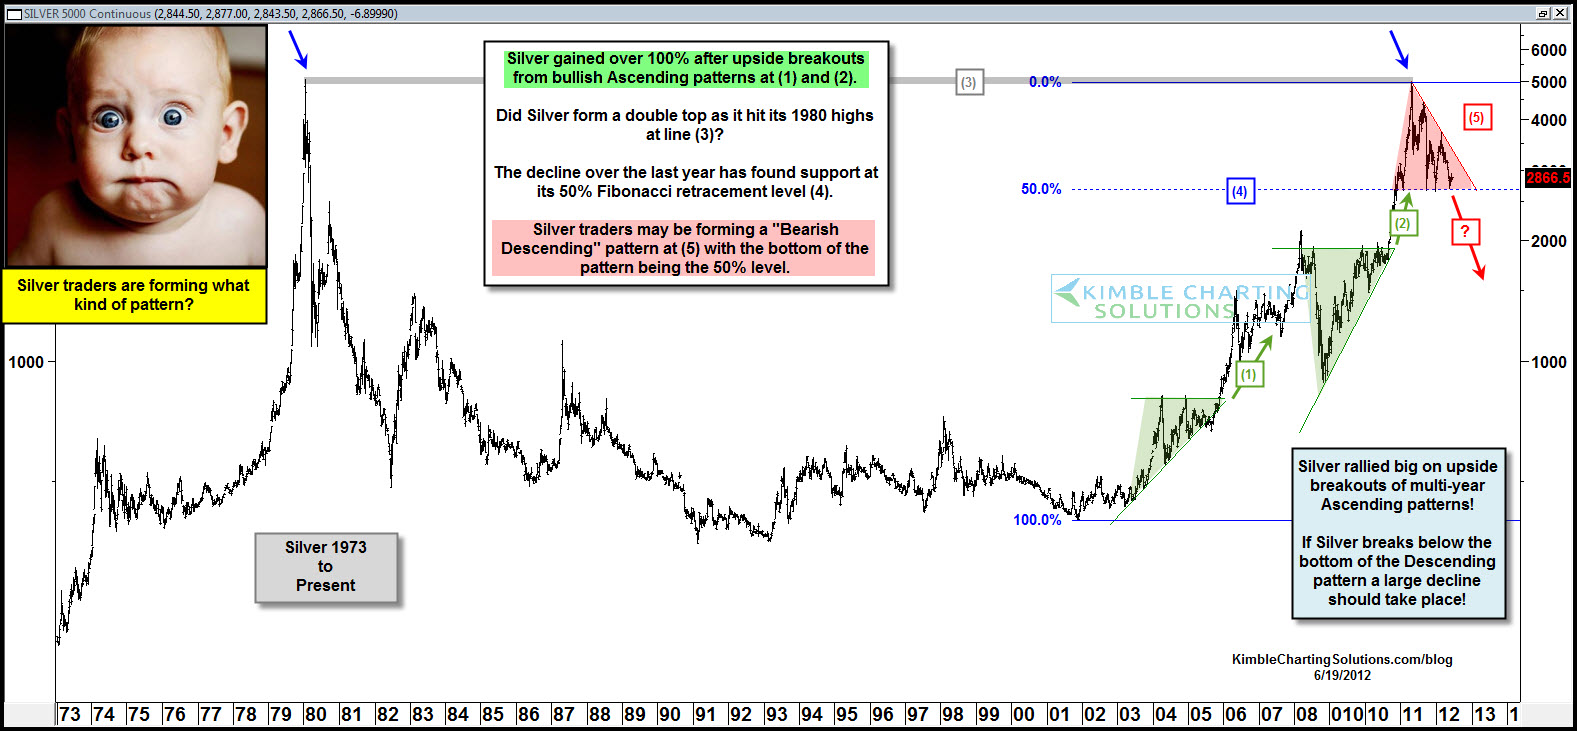
When Silver was trading at $28, almost off 50% from its highs, I shared the chart below in 2012, suggesting the Silver could fall to the $15 level.
Even though silver was down almost 50% back in 2012, the measured move suggested silver could fall to the $15 level, another 50% decline. So far the measured move has been correct over the past 3 years as silver has declined nearly 50% more since the posting in 2012.
Understandably, it's hard to find silver bulls right now, as bullish sentiment stands around 20% -- a far cry from the levels back in 2011 (82% Silver bulls)!
If the monster cup-&-handle pattern read happens to be correct, a big upside move would be in the cards.
Whether this read is correct or not, I feel it’s critical for silver on a long-term basis that it holds at (1) in the chart above. If not, its 4-year bear market continues!


