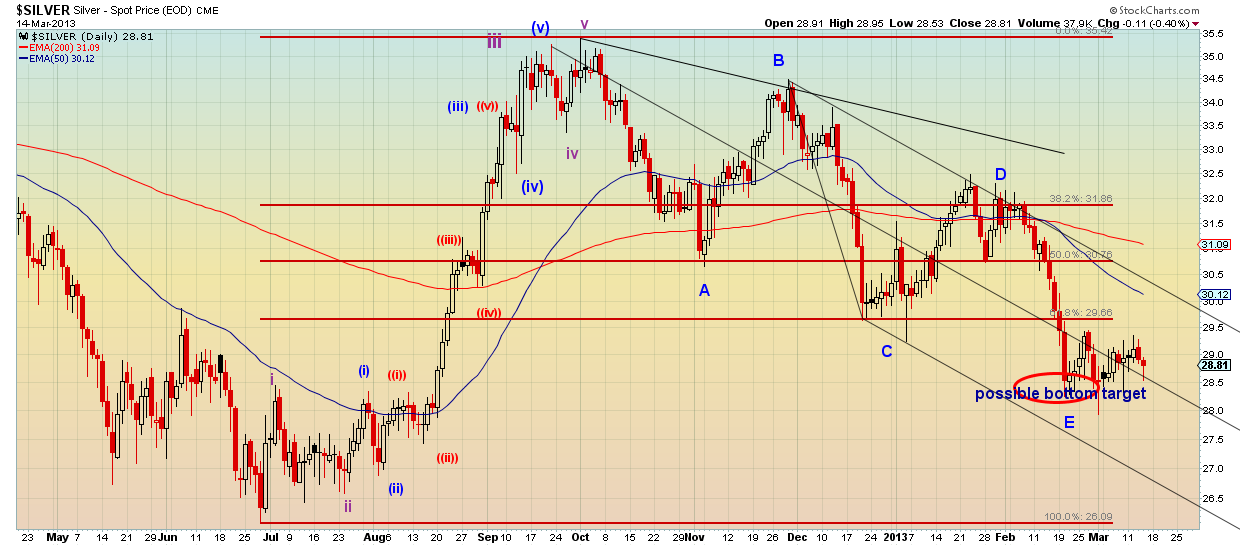
Silver has made a short-term bottom just above $28. The longer term Elliott wave count that we favor is shown in the chart below. Unfortunately for bulls, recent price action has no clear impulsive form, which is why we have to be cautious with any long positions.

Current levels could be the end of the correction that started from $35.5 area. A bullish sign that $28 is at least an intermediate term bottom would be if prices break above $30.12. An upward impulsive pattern will reinforce our scenario and wave count.
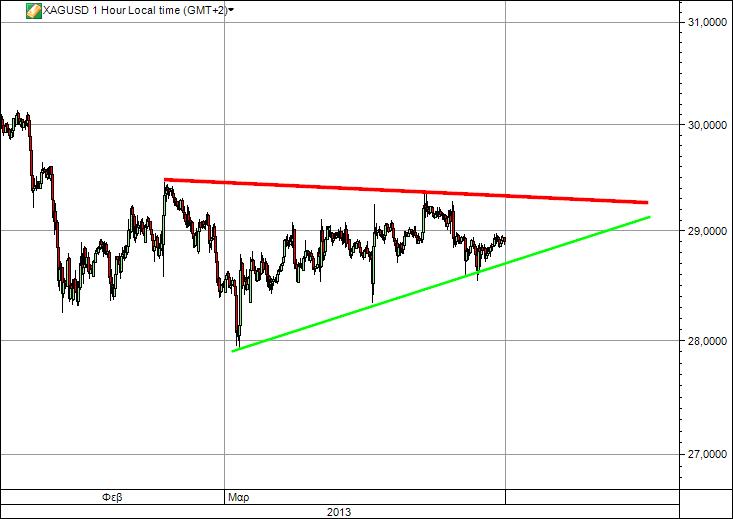
In the short-term, prices move sideways with a slight upward bias. As shown below, the triangle that is formed should be used as a trigger in order to take advantage of any breakout that occurs.

Breaking above or below the depicted green or red line will give a short-term push towards that direction. Our view is that it is more probable that a new low will be seen. We believe that it is more likely prices will break the green line rather than the red.
The form of the upward slide does not give us much confidence that it can continue higher and above the red line. However this sideways correction can continue higher and break the red line. If that happens we could see a small jump in prices.
Disclosure: None of the information or opinions expressed in this blog constitutes a solicitation for the purchase or sale of any security or other instrument. Nothing in this article constitutes investment advice and any recommendations that may be contained herein have not been based upon a consideration of the investment objectives, financial situation or particular needs of any specific recipient. Any purchase or sale activity in any securities or other instrument should be based upon your own analysis and conclusions.

Current levels could be the end of the correction that started from $35.5 area. A bullish sign that $28 is at least an intermediate term bottom would be if prices break above $30.12. An upward impulsive pattern will reinforce our scenario and wave count.
In the short-term, prices move sideways with a slight upward bias. As shown below, the triangle that is formed should be used as a trigger in order to take advantage of any breakout that occurs.

Breaking above or below the depicted green or red line will give a short-term push towards that direction. Our view is that it is more probable that a new low will be seen. We believe that it is more likely prices will break the green line rather than the red.
The form of the upward slide does not give us much confidence that it can continue higher and above the red line. However this sideways correction can continue higher and break the red line. If that happens we could see a small jump in prices.
Disclosure: None of the information or opinions expressed in this blog constitutes a solicitation for the purchase or sale of any security or other instrument. Nothing in this article constitutes investment advice and any recommendations that may be contained herein have not been based upon a consideration of the investment objectives, financial situation or particular needs of any specific recipient. Any purchase or sale activity in any securities or other instrument should be based upon your own analysis and conclusions.
