Bullish Divergence
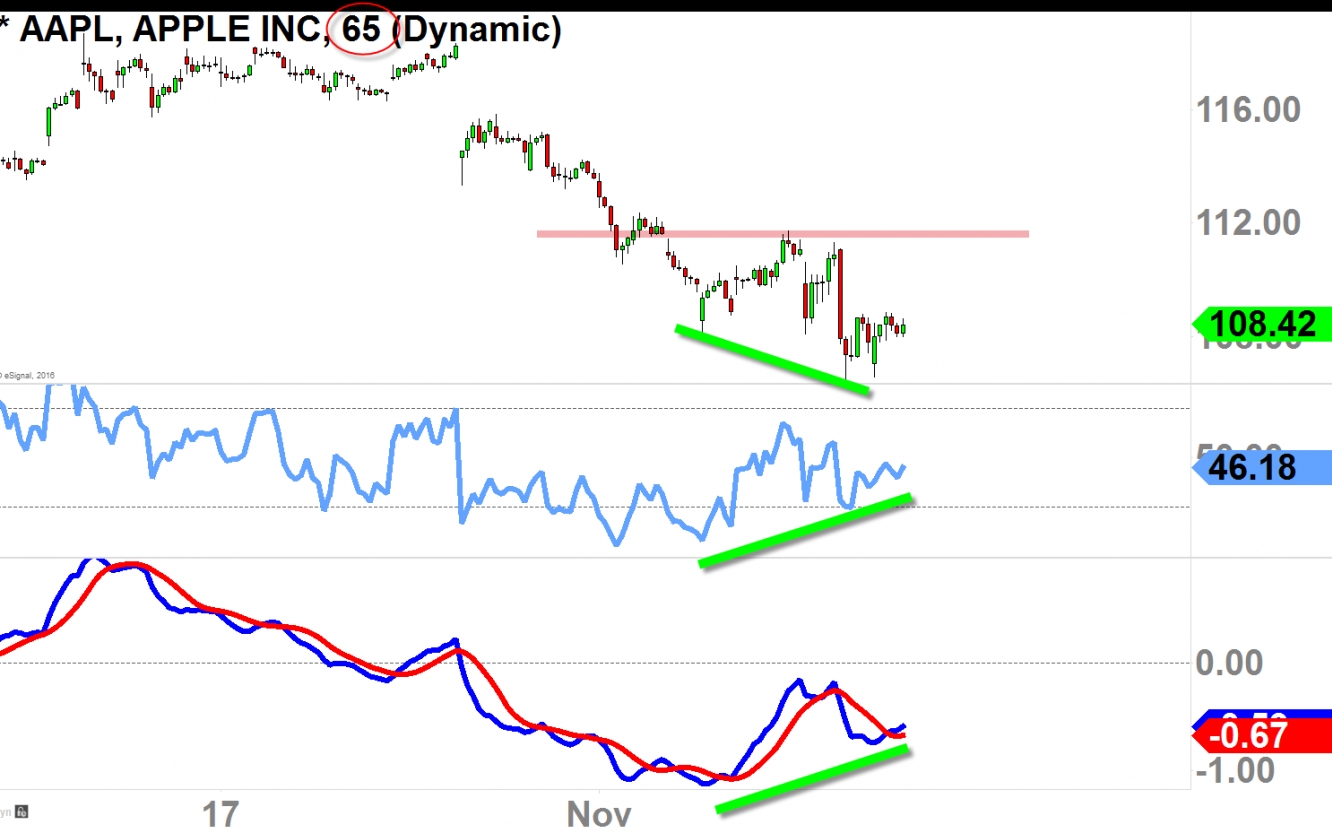
Chart you are seeing above is the 65-mins time frame chart of Apple (NASDAQ:AAPL).
This formation is what we call a Bullish Divergence formation in an early stage.
While the oscillators creates higher lows, the price-action creates lower low, hence the "divergence."
As of today, we do not have the full confirmation of this divergence, not just yet.
But in the event that the price clears and stays above the 112, that will be when this bullish divergence fully confirms, and when that happens, I do believe the price-action will draw in more buyers thus putting the price higher to about 117-118.
So then the question is, how do we know if this will play out or not?
Moving Average Pivot
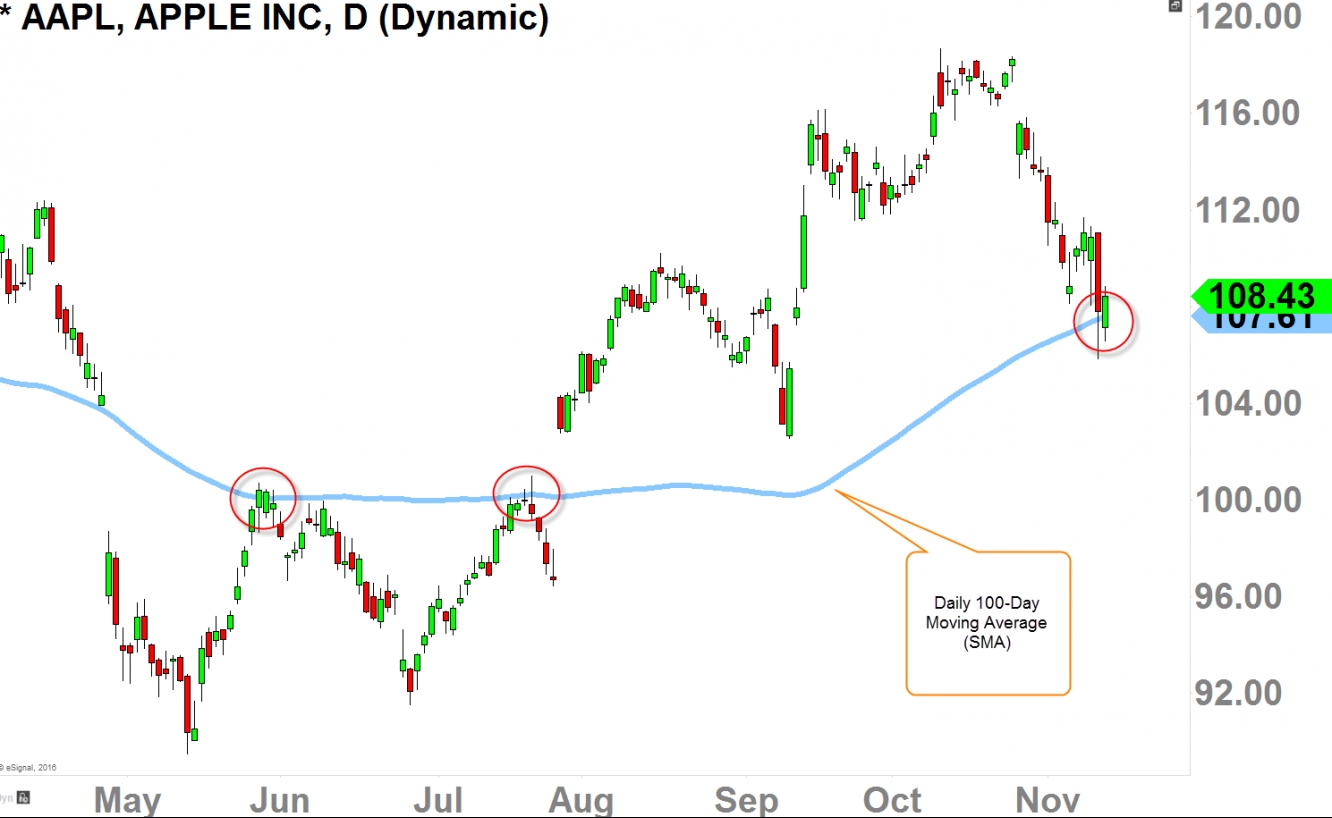
I think as long as we stay above the "100-Day Moving Average" shown in the chart above, I think there is a good chance that the bullish divergence might play out and the price getting above the 112-level.
This 100-day MA has been acting as strong resistance in late May and late July of this year, so it may act as strong support here.
Let's see how it plays out in the next 1-2 weeks.


