- S&P 500, Dow post consecutive all-time highs on Fed rate path, while ignoring spiking inflation and geopolitical risks
- Yield curve steepened the most in three years but failed to remain positive
- Oil’s gains on hurricane were mitigated by outlook for supply surplus
U.S. markets are likely to be volatile in the week ahead, after hitting all-time highs and with earnings season looming on the horizon. Contrarian investors who don’t want to continue running with the bulls might be looking to take some profits.
Stocks Friday recorded a second consecutive all-time high and achieved a second straight weekly gain, as investors focused on the outlook for stimulus while turning a blind eye to spiking inflation. The dollar dropped for the third day, but yields slipped.
The S&P 500 Index rose 0.46% Friday, with Industrials (1.77%) outperforming, followed by Materials (+0.99%). Technology added 0.73%. The trade-sensitive sectors rose even as a decline in Chinese imports of U.S. goods revealed a growing problem for global growth. Healthcare (-1.11%) continue to drag on the average since Bernie Sanders unveiled his plan for a single-payer health-care system. The sector also underperformed for the week, losing 1.4% of value, while Energy (+2.14%) led weekly gains ahead of a Hurricane in the Gulf of Mexico.
The expectations for global easing drove the Dow Jones Industrial Average up 0.9% -- closing above the 27,000 level for the first time. It was the index’s third straight gain and its second consecutive record.
Both the Federal Reserve and the European Central Bank are open for easing, with the latter considering a return to QE. The question investors must wrestle with now is how this shift in the path of interest rates will likely affect second-quarter earnings, which kick off next week.
S&P 500 Daily Chart
From a technical perspective, the S&P posted both a fresh record close and new all-time highs, closing at the top of the session and above the 3,000 milestone to boot. These are all very bullish signs.
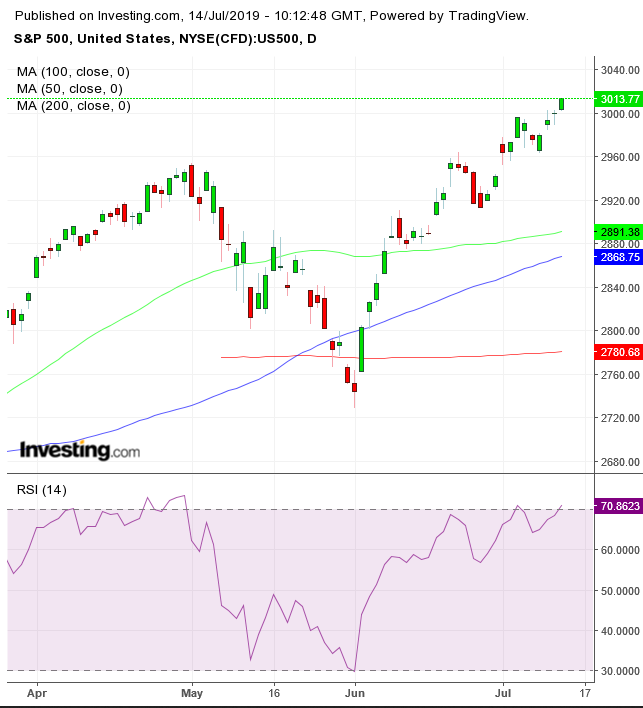
Investors, however, should remember that when the popular gauge crossed the 2,000 level for the first time, it moved sideways for two years, between 2014 and 2016. Contrarian investors, who may notice the most overbought RSI since April, which preceded a 7% drop, consider it a red flag when everyone is on the same page, especially when reasons to be cautious are plentiful.
Geopolitics took a turn for the worse late last week, when President Donald Trump accused China of violating its agreement to increase U.S. agricultural purchases. If that didn’t scare investors, perhaps weak data from China following Trump’s complaint raised yet another red flag for an economic slowdown.
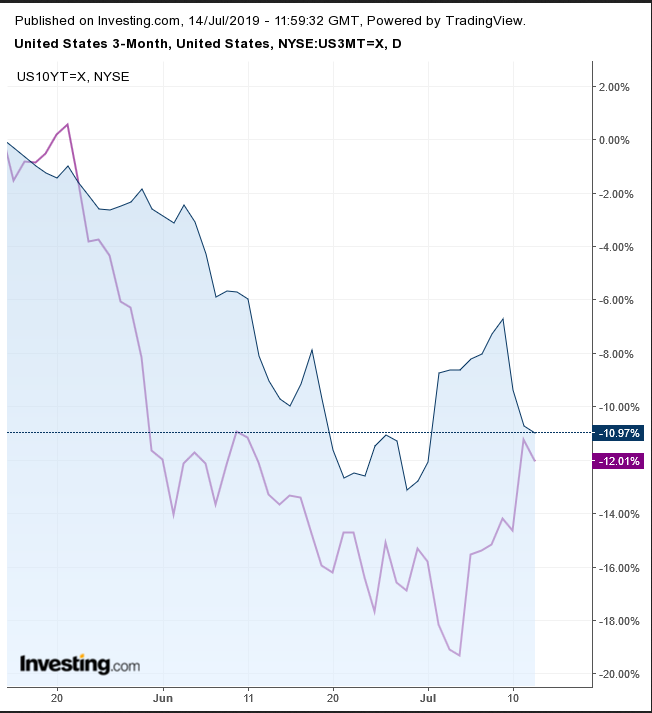
U.S. Yield Curve: 10 Year VS 3 Months Daily Chart
The yield curve of the 10-Year to 3-Month bond steepened the most in three years after Jerome Powell reiterated the Fed’s openness to rate cuts. On Friday, it briefly formed a positive yield, but 10-year notes still yield less than 3-month Treasurys.
DXY Daily Chart
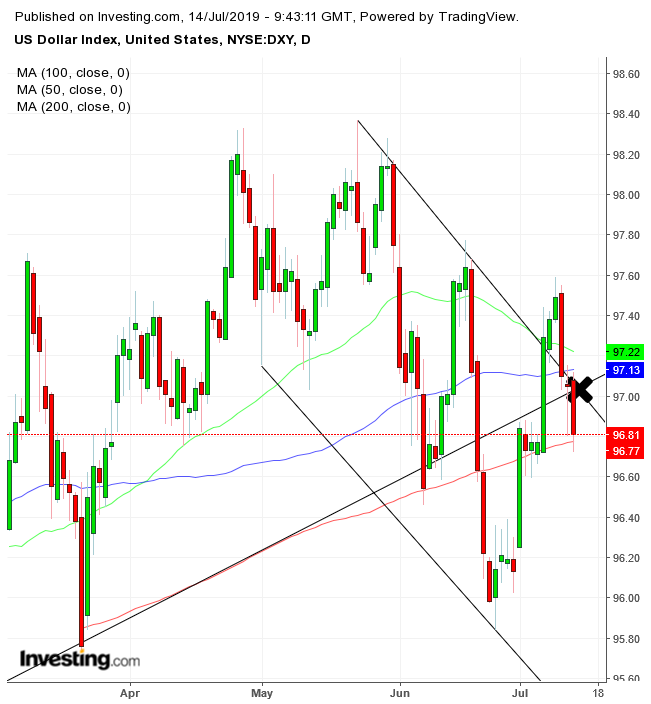
The dollar fell for the third day, back below its uptrend line since September and into the descending channel since the May peak, a trend crossroads marked by the X. On the positive side, the greenback found support by the 200 DMA.
WTI Daily Chart
Oil kept gains above $60 ahead of Tropical Storm Barry, as about 30% of the Gulf of Mexico production was out of commission.
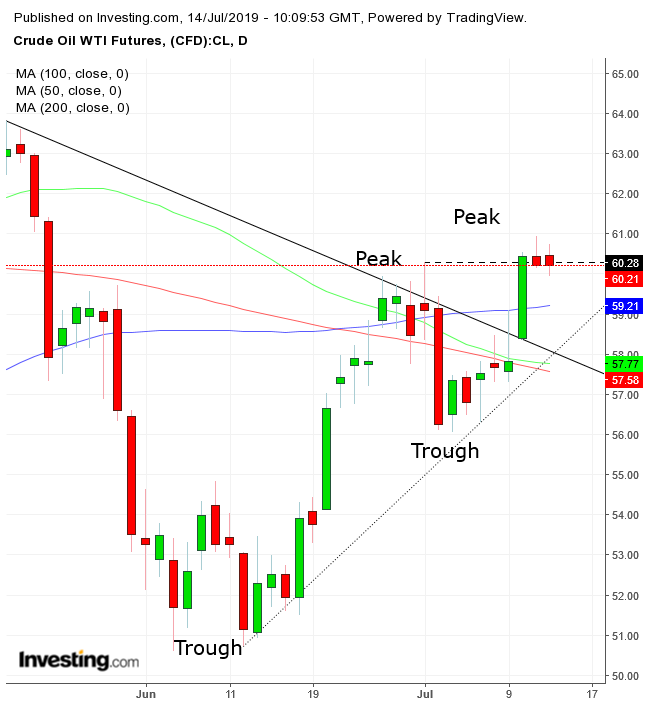
That number has increased to 70% over the weekend. An outlook for renewed supply surplus for the next year with expected U.S. shale production offset a more meaningful gain. Meanwhile, over the weekend, Foreign Secretary Jeremy Hunt announced that the Royal Marines would release an Iranian supertanker if the oil won’t go to Syria, putting the ball in Iran’s court. Technically, oil failed to overcome Thursday’s shooting star, which reaffirmed the resistance of a high wave candled triggered on July 1.
The Week Ahead
Monday
21:30: AUD – RBA Meeting Minutes
Tuesday
8:00: U.K. – BoE Gov Carney Speaks.
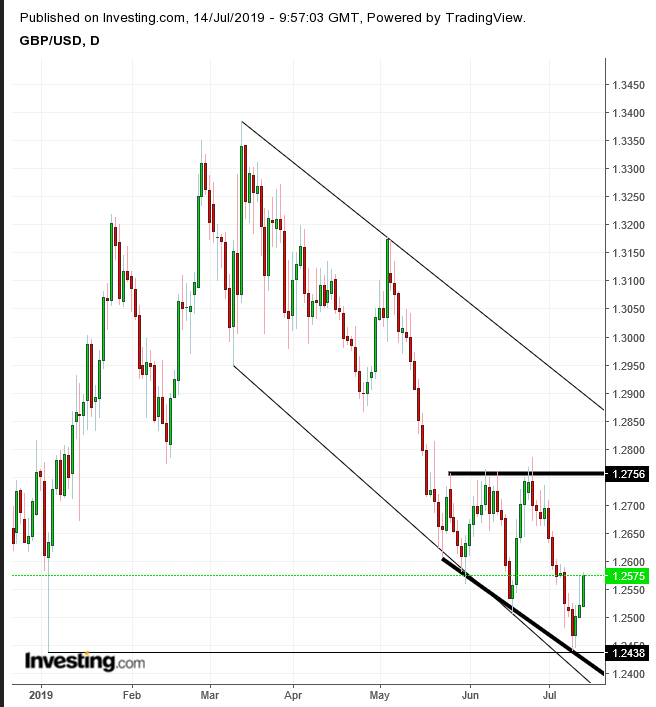
GBP Daily Chart
The GBP is forming a descending triangle, after reaching last week two pips above the Jan. 3 low. A lower trough would extend the downtrend since the March peak.
8:30: U.S. – Core Retail Sales expected to plunge to 0.1% from 0.5%. If beat, investors might see a pattern with the last U.S. jobs number, and Friday’s inflation spike, sending the market into a scramble over the Fed’s interest rate path.
13:00: U.S. – Fed Chair Powell Speaks investors might comb the language for any reference to Friday’s inflation surprise.
Wednesday
4:30: U.K. – CPI is seen to remain flat at 2.0% YoY.
5:00: Eurozone – CPI also forecast to stay steady at 1.2% YoY.
8:30: U.S. – building permits probably notched higher to 1.300M from 1.299M.
10:30: U.S. – Crude Oil Inventories draw of 3.081M is expected.
Thursday
4:30: U.K. – Retail Sales expected to be -0.3% from -0.5% MoM.
8:30: U.S. – Philadelphia Fed Manufacturing Index forecast to surge to 5.0 from 0.3.
Friday
8:30: Canada – Core Retail Sales expected to rise to 0.3% from 0.1% MoM.
