Summary: On Tuesday, the VIX closed below its lower Bollinger® Band for the first time in a year. In the past, this has very often led to at least a 5-10% increase in VIX in the weeks ahead. But the affect on the SPDR S&P 500 ETF (ARCA:SPY) has been mixed; just over half of instances were followed by a decline of at least 1% in the week ahead.
VIX measures the market's expectations for volatility over the next month. A low VIX implies that expectations are for little volatility looking ahead. Yesterday's VIX was near 12, one of the lowest levels in the past year. Given the small daily and weekly movements in the SPY over the past several months, it is not surprising that the VIX is low.
Bollinger Bands measure the movement of price around its mean. Using the most common set-up, a movement outside of the upper or lower Bollinger Band is equal to 2 standard deviations from a 20-day moving average. Price should fall outside of the upper or lower Bollinger Band only about 5% of the time, so when this occurs it is noteworthy.
On Tuesday, VIX closed below its lower Bollinger Band for the first time in more than a year. In the past 5 years, this happened only 15 times.
What happens next?
VIX itself has a strong tendency to rise in the days and weeks ahead. In 14 of the 15 instances, VIX increased by at least 5% and it increased by more than 10% in more than half of all instances.
Normally, SPY moves opposite to VIX; So an increase in VIX would typically lead to a decline in SPY. But that's not always the case, and in the 15 cases where VIX closed below its lower Bollinger Band, SPY fell more than 1% only about 60% of the time. Stocks have a natural tendency to rise, so the likelihood of a decline is slightly elevated, but the edge is not significant.
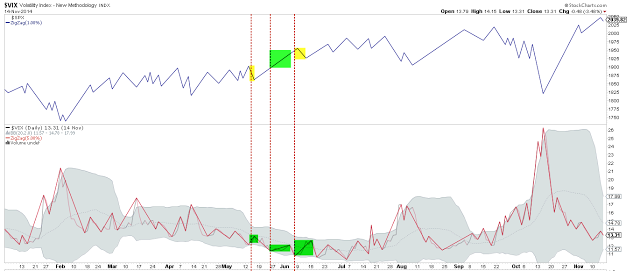
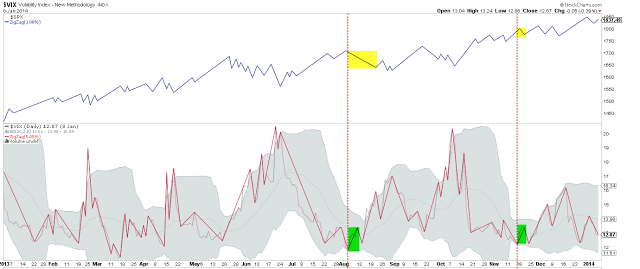
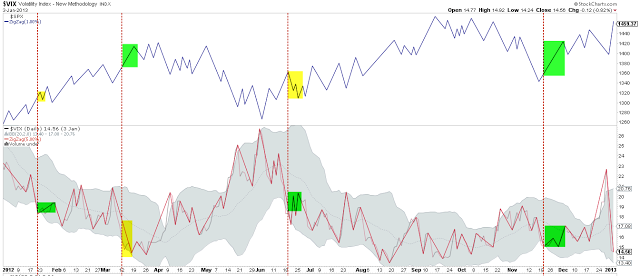
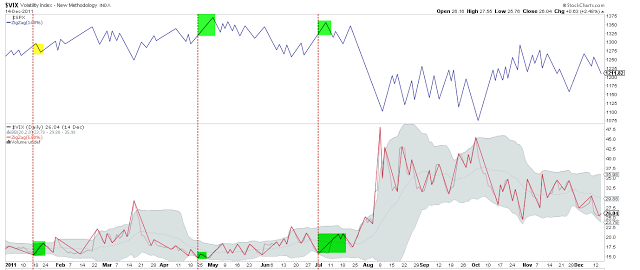
The charts below show every instance where VIX closed below its lower Bollinger Band since 2010 (vertical lines). SPY is in the top panel and VIX is in the lower panel. A rise of more than 1% in SPY is highlighted in green, a decline in yellow. The same applies to VIX, except the threshold is a rise or fall of more than 5%.
In 2014, there were 3 instances when VIX closed below its lower Bollinger Band. VIX rose every time, once by more than 10% (lower panel). SPY fell by more than 1% twice but rose unabated once. The overall uptrend in SPY was not affected.
In 2013 there were only 2 instances, and VIX rose by more than 10% both times. SPY fell both times and struggled in the weeks ahead.
In 2012, there were 4 instances, including one where VIX continued to fall and one where VIX rose by more than 10%. The affect on SPY was split 50/50.
In 2011, there were 3 instances, including 2 where VIX rose more than 10%. Of note: SPY rose in the week ahead twice but both times were significant market tops (May and July).
In 2010, there were 3 instances, with SPY falling twice and rising once. The one rise, however, led to the worst gains going forward, as SPY fell significantly in the following month (May).
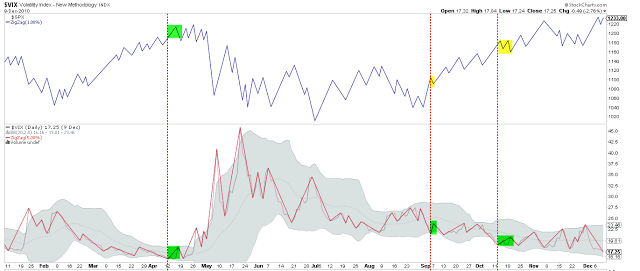
Of the 15 cases, 4 occurred within a few weeks of a more than 5% fall in SPY (yellow). Three of these falls were more than 10%. The last one was in mid-2012. In most cases, SPY continued higher unabated.
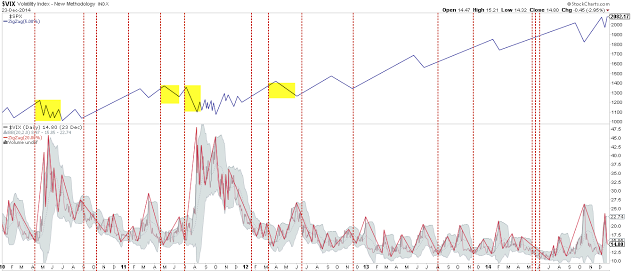
In general, when VIX closed under its lower Bollinger Band, volatility rose by at least a 5-10% in the weeks ahead. But the affect on SPY has been mixed. On its own, this is not a warning to expect a dramatic fall in equities in the weeks ahead.
