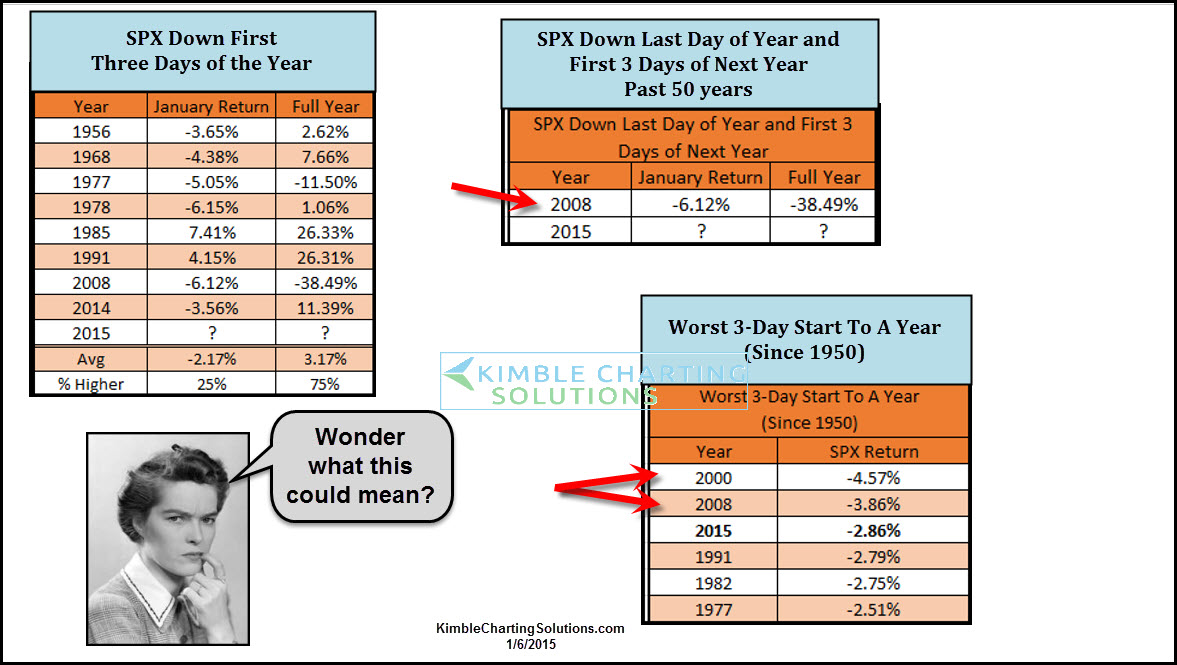
Upper left chart highlights when the S&P 500 was down the first 3-days of the new year along with full-year returns. As you can see, year-end results were mixed.
The upper-right chart highlights times when the index was down during the first three days of a near year, as far back as 50 years.
That happened just one time -- back in 2008.
The lower-right chart shows the worst 3-day starts to a new year. They came in 2000 and 2008.
Each of those milestones just occurred along with one of the weakest 'Santa Claus' rallies in 25 years.
Time will tell if this rare, slump-of-a-start to 2015 will have any impact on the markets at year's end.

