While my “emotions” are currently screaming to start increasing equity allocations at this juncture, there are several reasons why my discipline is keeping me from doing so currently:
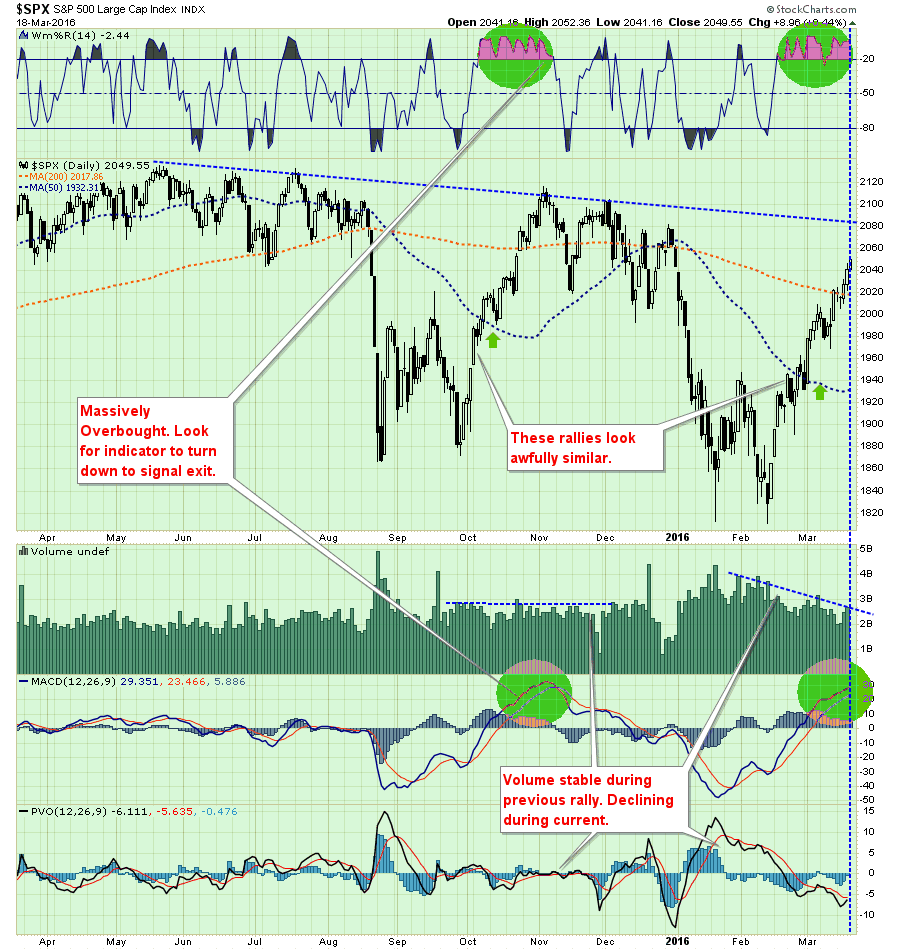
- The market is GROSSLY overbought in the short-term and will have either a mild corrective process or consolidation to allow for an increase in equity exposure.
- Negative trends are still in place which suggests the current rally, while significant, remains within the context of a reflexive rally.
- Volume is declining on the rally suggesting a lack of conviction.
- This rally looks very similar to the rally last October except the fundamentals are substantially weaker.”
While I have maintained a cautious stance in portfolio allocations since May of last year, I have reiterated many times that interventions by central banks could change the shorter-term dynamic of the markets from bearish back to bullish. These past few weeks have seen exactly that occur.
The question that we must primarily answer is whether enough “technical repair” has been completed to warrant an increase in equity exposure in portfolios. As stated above, the “risk” that the current “bear market” rally is nearer completion outweighs the possibility currently the markets are changing back to a “bull market.” Therefore, it is more prudent, for long-term investors, to remain cautious for now.
Only 4% From All-Time Highs
Yesterday, while I was at the gym I looked up to see a “talking head” on CNBC stating the markets are only 4% off of their all-time highs. He was making the case, of course, that the “bull market was back” and the recent sell-off was a “buy the dip” opportunity. But is that really the case? Of course, we will never know for certain until we have the clarity of hindsight. However, since we can’t invest with hindsight we must make some assumptions, or should I say “guesses” about what will happen in the weeks and months ahead.
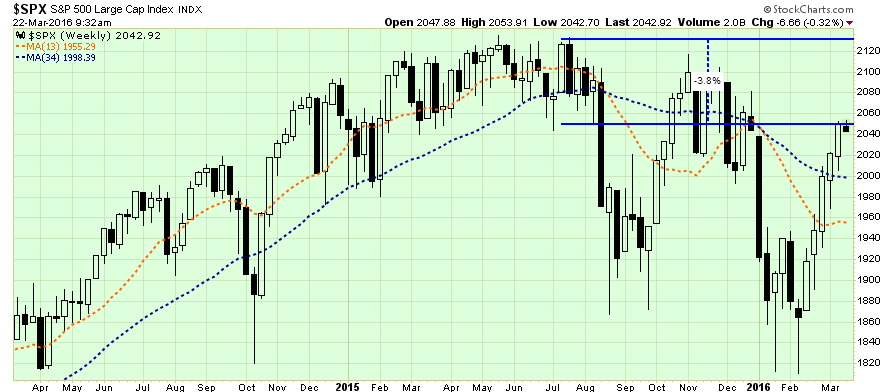
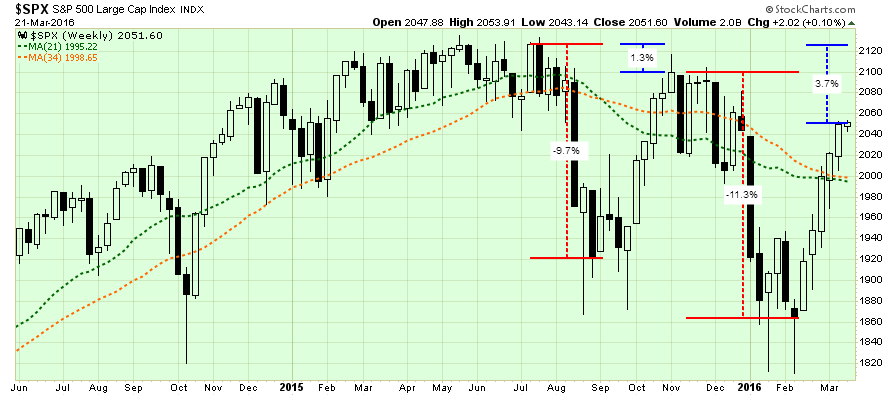
He is correct. The markets are just off of their all-time closing highs as of yesterday’s close as shown below.
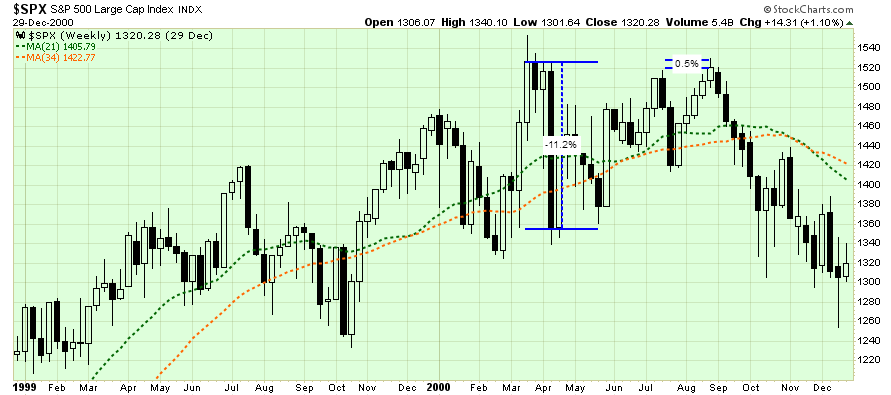
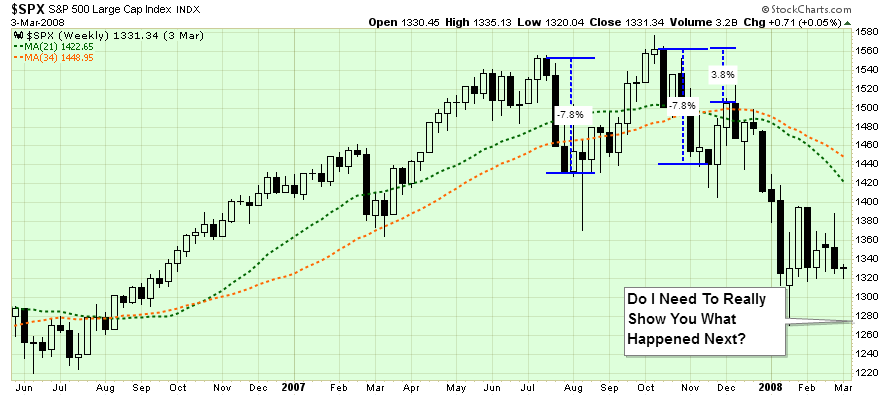
However, this is only part of the story as the current action in the market is still reminiscent of “broadening market tops” we have witnessed in the past. A quick review of 2000 and 2007 show some important similarities to the current market environment.
In 2000, as the market began its long and drawn out topping process, the market plunged by 11.2% in early 2000. The market then rallied back to within just 0.5% of setting new all-time highs before the “dot.com” crash set in.
We can see the same “topping process” again in 2007. In August of that year, the market dropped almost 8% and then subsequently rallied to a new “all-time high” leading the bulls to chastise the “bears” for missing out on a “buy-the-dip” opportunity.
The market then dove again, another 7.8% decline, followed by a new rally to within just 4% of all-time highs. The airwaves were filled with chatter the “bull market” remained intact as “green shoots” and a “Goldilocks economy” were evident.
Nothing was further from the truth.
Let’s look at the current market environment once again.
As shown above, the current market environment remains very similar to those previous market topping processes. The 8.7% in late summer rallied back to being just shy of setting all-time highs. The “bulls” were lured back into calming waters just as the next wave crashed upon them sending markets down 11.3% to closing lows.
Yes…the markets are once again just 3.7% off of their closing highs. The rally from the lows has been extremely sharp and has once again lured the “bulls” back into the water. Could this be when the markets break out to new “all-time” highs and re-establish the underlying bullish trend? Possibly. Or, could this be another rally within an ongoing topping process that leads to sharper losses in the future?
The Long-View
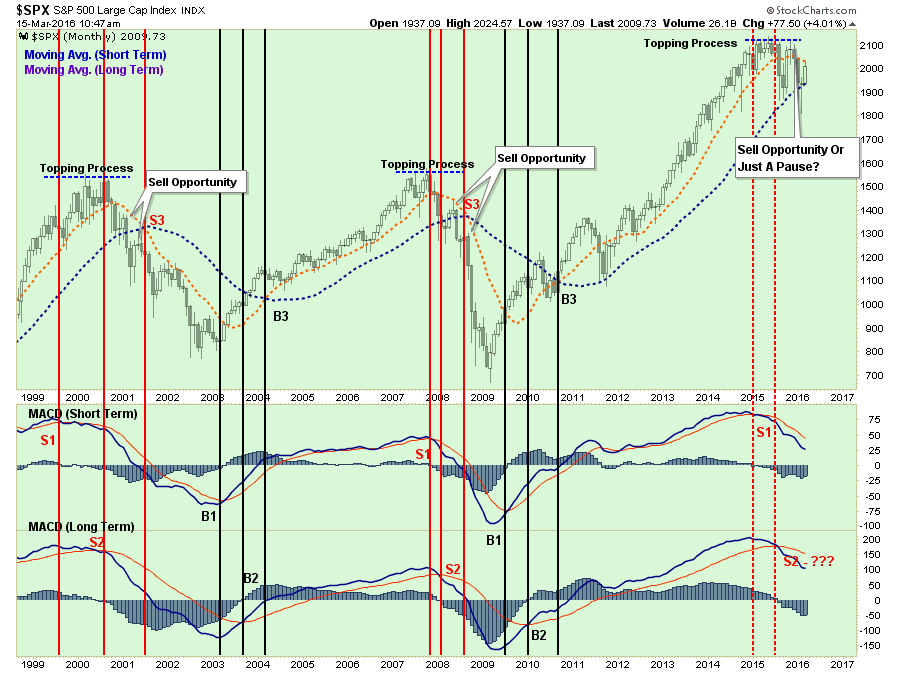
While the technical backdrop has indeed improved in the short-term, the longer-term picture still remains worrisome. As shown below, two of the three major monthly sell signals have been triggered. The last will be the crossover of the short-term and long-term monthly averages. As discussed previously, due to the length of time involved in monthly moving averages, by the time this signal crosses the bear market will already be in full swing. However, what is important to note is that all the signs of previous market action during a major market topping process are present.
“If the markets fail to rise above the short-term moving average and then correct below the long-term, which has currently been acting as support, that will be the beginning of a confirmed bear market cycle.
Conversely, if the market can rally above old highs and, reverse the two lower sell signals, the bull market will be reconfirmed and equity exposure will need to be increased. Of course, at this moment, given the economic and fundamental backdrop, this is a low probability event. Note: I did not say it was IMPOSSIBLE, just IMPROBABLE.
As investors, who have no control over future outcomes, our job is to understand and play within the confines of statistical probabilities rather than making bets on possibilities. The latter is the playground of amateur gamblers who regularly supplies Las Vegas with the operating capital it needs to function.”
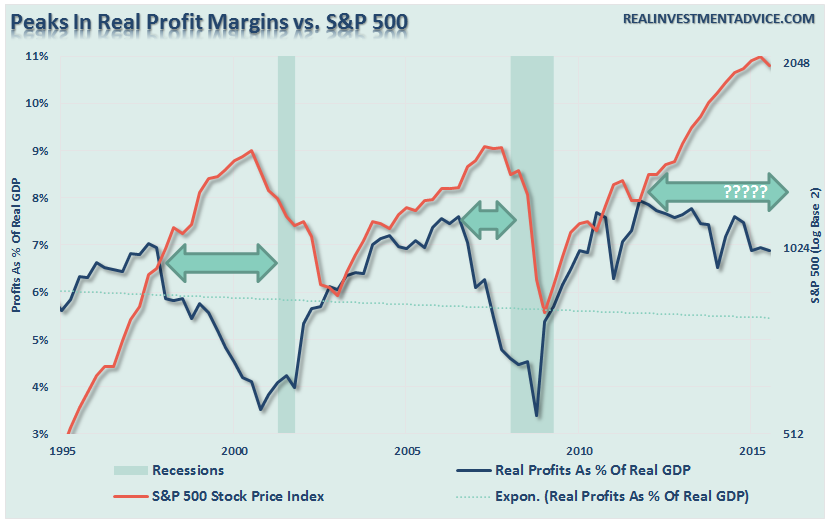
However, as we approach summer, the seasonal weakness of the markets will likely resurface as the reality of Central Bank interventions are digested and focus once again returns to the real driver of asset prices longer term – profits. As shown below, that is also another picture more reminiscent of past problems for the “bulls.”
We will not know for certain until well into the future when either the “bulls” or “bears” can claim victory. Unfortunately, we don’t have the ability to invest with hindsight.

