Monitoring purposes
- SPX: Sold long SPX on 7/16/15 at 2124.29 = gain 1.05%. Long SPX on 6/25/15 at 2102.31.
- Monitoring purposes Gold: Flat
- Long Term Trend monitor purposes: Flat

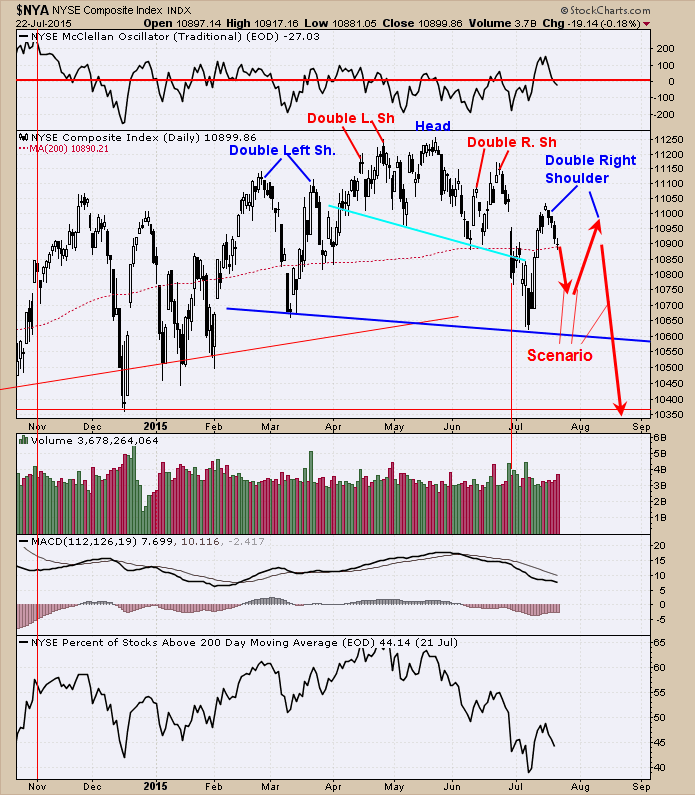
On yesterday’s report we showed that the McClellan Summation topping out below +500 and the Bullish Percent index turning down below +65% have lead to big declines and both of these indicators are below the bearish levels. The chart above is the daily NYSE. The pattern forming appears to be a Head and Shoulders top. The left shoulder has two humps and to keep the symmetry the Right Shoulder should have two humps. The Right shoulder has just one hump and another hump is needed to complete the pattern. The bottom window is the NYSE percent of stocks above their 200-day moving average and notice it hit a new low in early July with the NYSE making a higher low. There are many other divergences going on suggesting a top is building here.
Staying neutral for now.

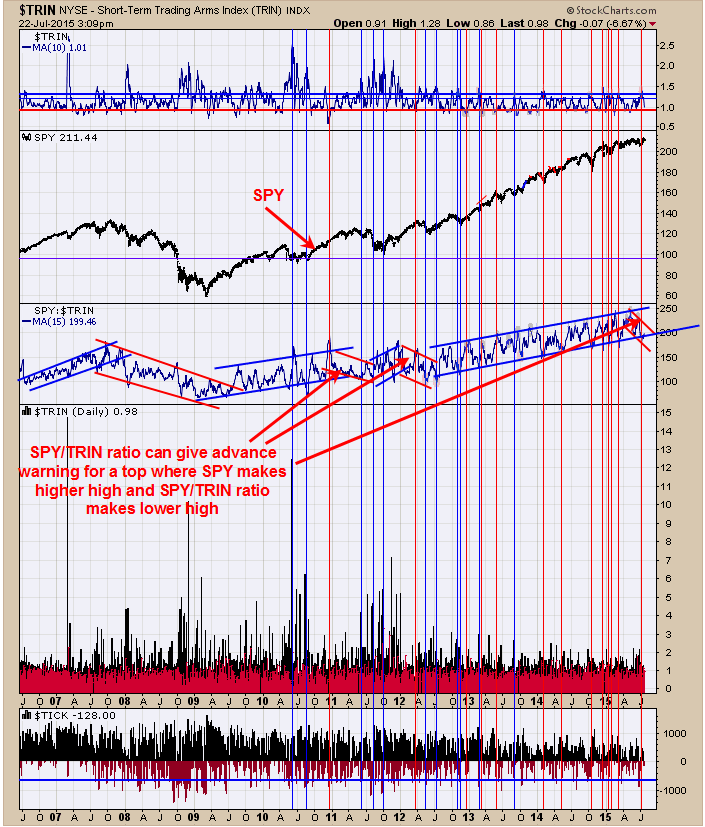
Above is the daily chart of the SPY)/TRIN ratio (middle window going back to mid 2006. It has been a bearish sign for the market when the SPY makes higher highs and the SPY/TRIN ratio fails to reach its previous highs. Going into the 2011 top the SPY/TRIN ratio turned down before the SPY did and warned a top was nearing. Also the April 2012 top saw the SPY/TRIN ratio turn down weeks before its final high in the SPY. The SPY touched a new high on July 20 and the SPY/TRIN ratio started to make lower highs form early May. This divergence suggests a top is building. Sold long SPX on 7/16/15 at 2124.29= gain 1.05%.

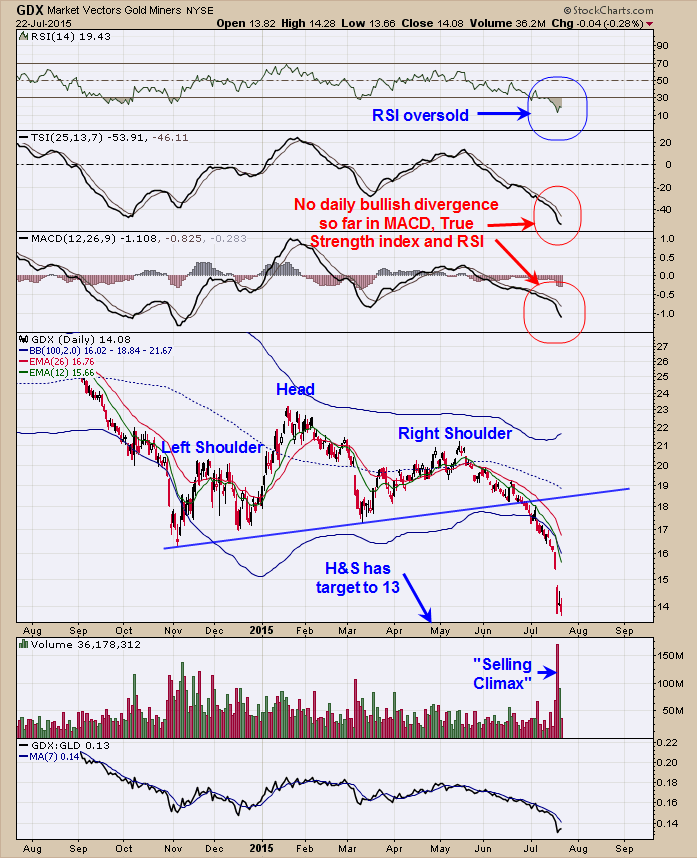
The monthly Charts on gold and gold indexes are still pointing down but are showing some divergences suggesting a bottom is not far off. The chart above is the daily Market Vectors Gold Miners (ARCA:GDX). It looks as though a Head and Shoulders pattern formed which as a downside target near 13. Monday a “Selling Climax” occurred and suggests short term exhaustion to the downside and market halt short term and build a trading range. The top window is the RSI which as reached oversold levels and also suggests a base may be forming short term. So far the RSI, True Strength index (TSI) and the MACD are not showing any divergences. Could back and fill short term for GDX and a trade could work out to the upside. Staying neutral for now.
