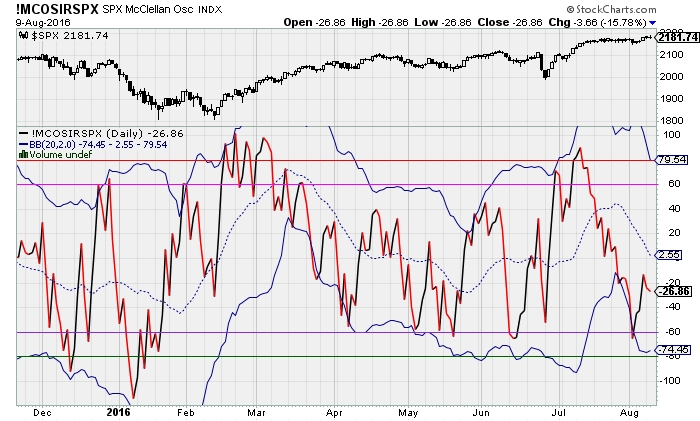
The recent market rally may have reached its crecendo for now as underlying market breadth has been deteriorating over the past weeks. The chart below shows the McClellan Oscillator for the S&P500: SPX-MO. It simple measures how many stocks are advancing vs declining. A postive reading means more stocks are going up than down, and vice versa for a negative reading.
What does this recent negative breadth mean? Less and less stocks are participating in the uptrend, while in fact more and more stocks have been declining. Hence, fewer stocks are pulling the wagon. Dare we say Apple Inc (NASDAQ:AAPL), Alphabet Inc (NASDAQ:GOOGL), Microsoft Corporation (NASDAQ:MSFT)?
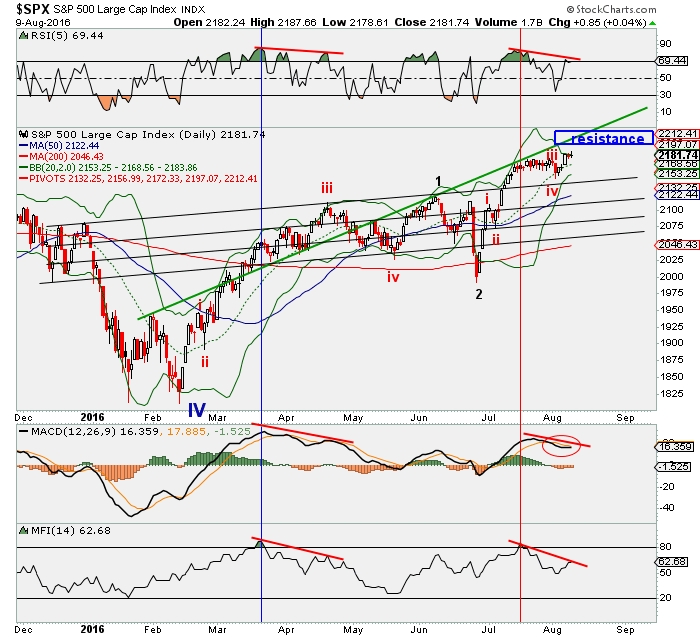
From an Elliot Wave perspective we can count 5 waves (red i, ii, iii, iv, and v underway) up off the BREXIT low; labeled as black 2. This means with the final 5th (v) underway, a retrace of the recent advance is likely on tap. When we look at the technical indicators, we see negative divergences (red lines) gallore, similar to spring of this year. Now divergence is only divergence till it isn't, but it also tells us upside momentum is waning and caution should be adviced.
Of course price is nicely above the 20d, 50d, and even 200d SMA, hence the uptrend is still in tact, but the Bollinger Bands® have become very tight, foretelling a larger move is coming, and with all the aforementioned divergences in place we may very well be looking at a quick retrace over the next two weeks before the uptrend resumes. A retest of the prior ATH level made in 2015 (SPX 2135) would certainly not be out of the order and in fact be healthy. The black trendlines tell us where we can expect support going forward and based on Fibonacci-retrace levels ranging from 38.2-61.8% we expect a low in the SPX2160-2120 range. After that we also expect the market to rally much higher; preferably to 2500 before the next larger correction sets in. Hence, maybe first a bit down (to shake out the weak hands) before going back up!?


