Recently, IMRA LLC. published a study for one of its clients regarding monthly returns (excluding reinvestment of dividends) for the S&P 500 since 1928. The study uncovered some interesting data regarding monthly returns and revealed some contradictions as well as endorsements of popular myths. The study was inspired by a recent story that appeared in Wall Street Journal -- Playing the September Effect.
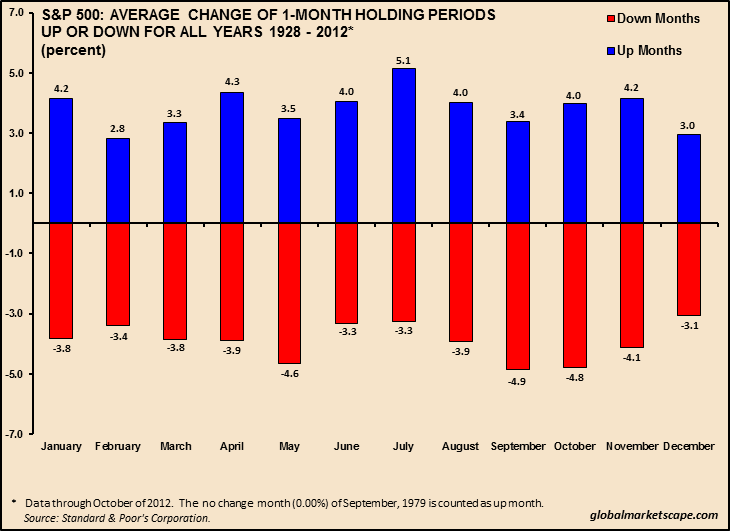
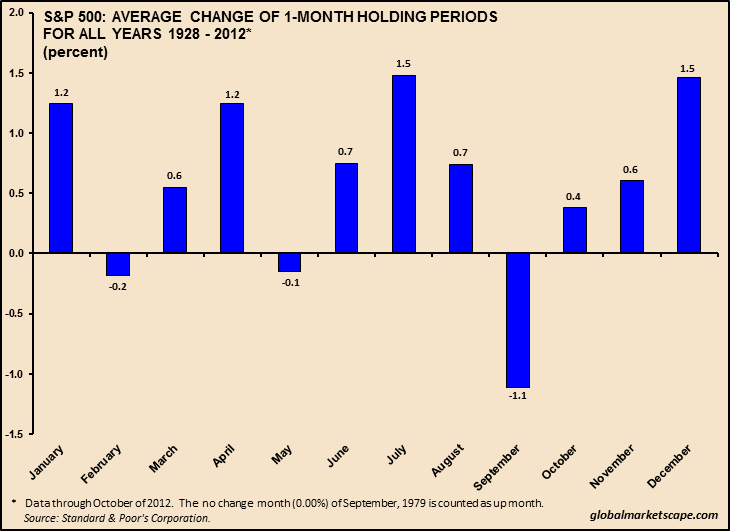
October jinx-- October has a special place in the financial calendar, and it's commonly believed in the financial world to be the most fearful month, as historically it has been prone to more crashes than any other month. Stock Traders' Almanac calls October the "jinx month." Since 1928, on average the S&P 500 has risen .4% during Octobers (see Fig. 3). In the same period, S&P 500 has risen 59% of the Octobers, gaining an average 4.0% (see Fig. 1 & Fig. 2). When it fell in Octobers, which is 41% of the time since 1928, the average decline was 4.8%. The events that have given October a bad name in more than 80 years since 1928 are:
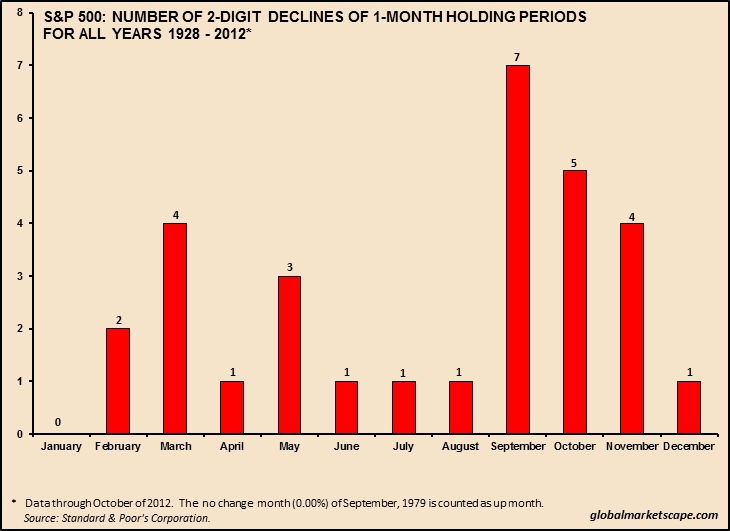
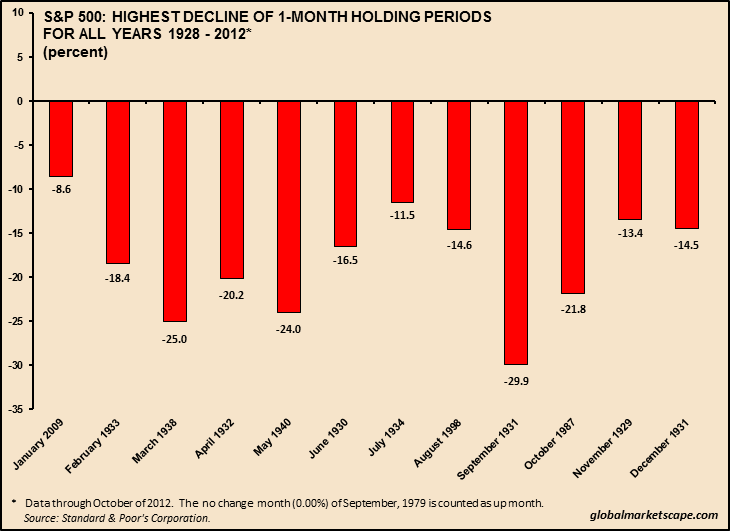
December and January -- Of course, there are some effects named after these months as well - "Santa Claus effect", the "December effect", and the "January effect". Keeping aside these anomalies, the study revealed that since 1928 Decembers have been up 75% of the time vis-à-vis Januarys, which have been up 64% of the time (see Fig. 1). Thereby, we can deduce that Decembers have declined only 25% of the time compared to the 36% of the time during Januarys. The average gain in Decembers since 1928 is 3.0% compared to that of 4.2% in Januarys, while the on average the decline is 3.1% and 3.8% respectively (see Fig. 2). The average return of Decembers for more than eighty years has been 1.5% tying for the first spot with Julys (see Fig. 3), while Januarys (as well as Aprils) returned an average 1.2%. The number of two-digit monthly declines in Januarys since 1928 is zero, whereas Decembers have registered a one two-digit decline, of 14.5% in December 1931 (see Fig. 4, Fig. 5 and Fig. 6).
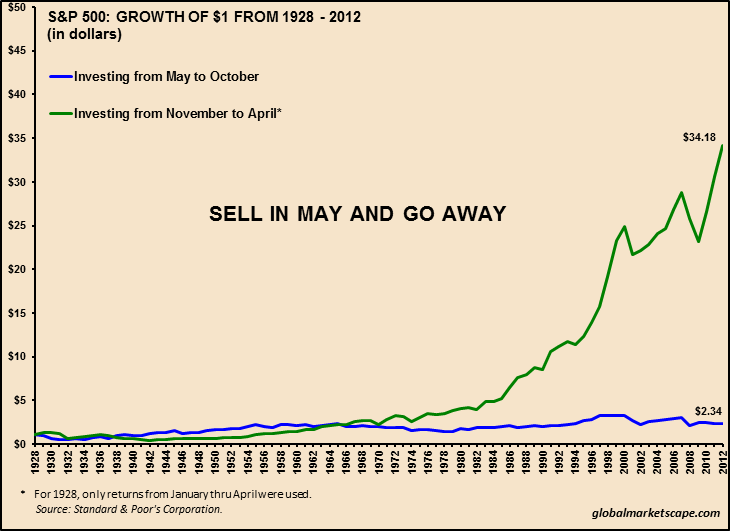
Sell in May and go away - If you look at Fig. 11, you can see that if you are fully invested in S&P 500 from November to April, and for the rest of the months in cash, a $1 invested in 1928 would have become $34.18 at the end of October of this year. Conversely, that is if you had fully invested in S&P 500 from May to October and stayed in cash for the rest of the months in the year, a $1 investment in 1928 would have become $2.34 at the end of October this year. Definitely, this result endorses the belief in "sell in May and go away." In fact, if you look at the figure closely, the effect has been more prevalent in the last forty or more years.
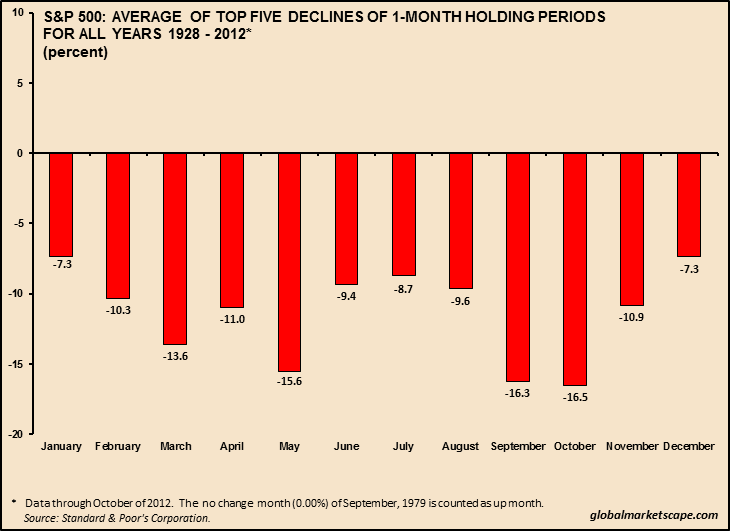
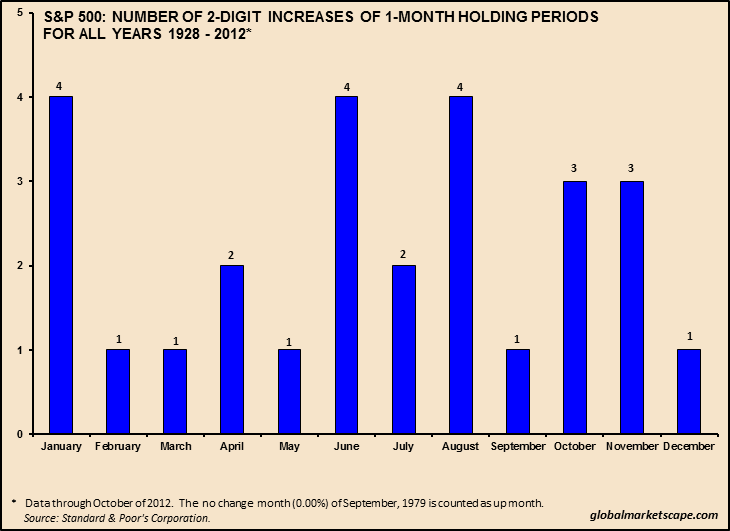
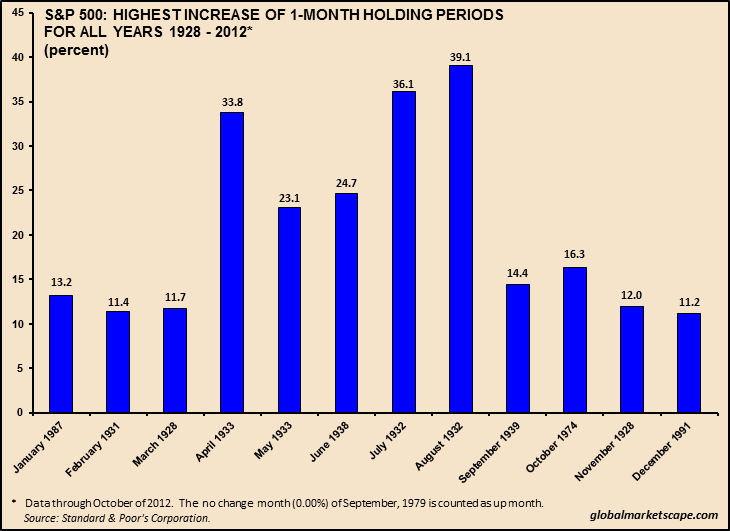
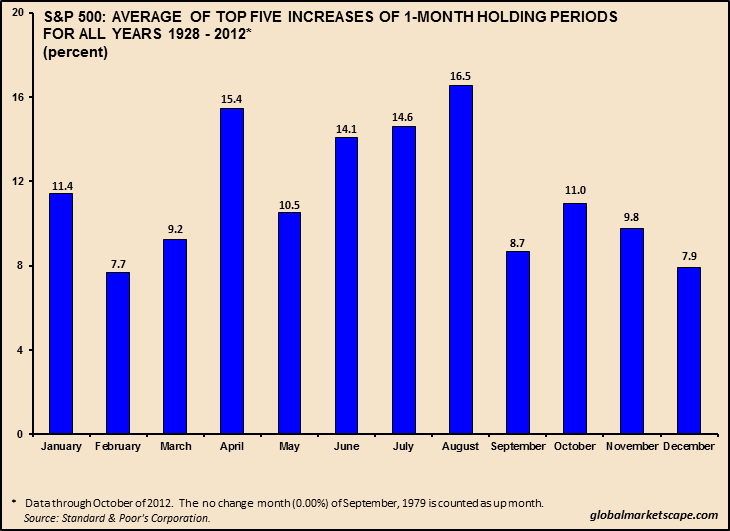
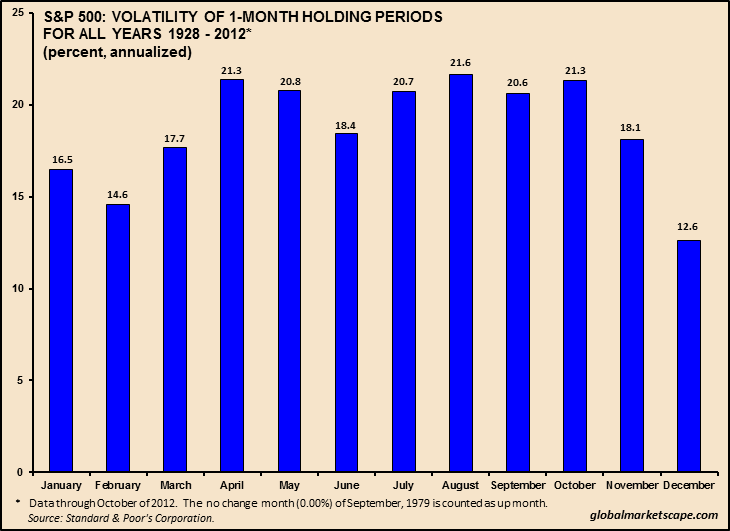
Otherwise speaking -- Januarys, Junes, and Augusts each have recorded the highest occurrences (four) of two-digit monthly increase by S&P 500 since 1928, closely followed by Octobers and Novembers with three each (see Fig. 7 and Fig. 8). Most of the highest occurrences of two-digit monthly increase or decrease by S&P 500 have occurred mostly during the depression era after the stock-market crash of 1929. It is likewise for the top-five increases or decreases of S&P 500 in a month since 1928 (see Fig. 6 and Fig. 9). The annualized volatility of monthly returns since 1928, segregated by months, have been identified in Fig. 10, and it shows that volatility of monthly returns for more than last 80 years has been the highest for Augusts at 21.6% followed by Aprils and Octobers at 21.3%.
As an analyst I would take this study with a pinch of salt, as the time-frame covered - 1928-2012 - is a long time, the underlying variables like trading rules and technology have gone a sea change in the intervening period. With the coming of information age in the sixties and rapid technical innovations in the realm of information technology and financial products, market efficiency has definitely improved in the last forty years or so. So comparing monthly returns across more than eight decades is not entirely a worthwhile exercise, but it would be interesting if we rerun the same study for the last five decades or so and draw conclusions. Doing such an exercise would also capture purely the real-time performance of S&P 500 from March 4th 1957, when the index came to existence as alluded to earlier, and exclude the effect of the mathematically imputed fictitious returns for periods prior to 1957. My next article would replicate this study for the time period starting from 1960 and analyze the results.
Conclusion: Albeit we do not have unequivocal evidence to conclude that certain individual months are better than others for investing in S&P 500 as a whole, we do have compelling evidence that "Sell in May and Come Back in November" is a viable strategy for investors as we can see in Fig. 11. The month of May could be used as a time-trigger to underweight S&P 500 in investment portfolios, and likewise Novembers could be used to overweight S&P 500. There are some months that might look attractive for S&P 500, but it would be senseless to hazard an opinion at this juncture, as discussed earlier, the analysis is clouded by the volatility that was seen in the pre-war years. So, a study on the S&P 500 from 1960 should yield conclusive results.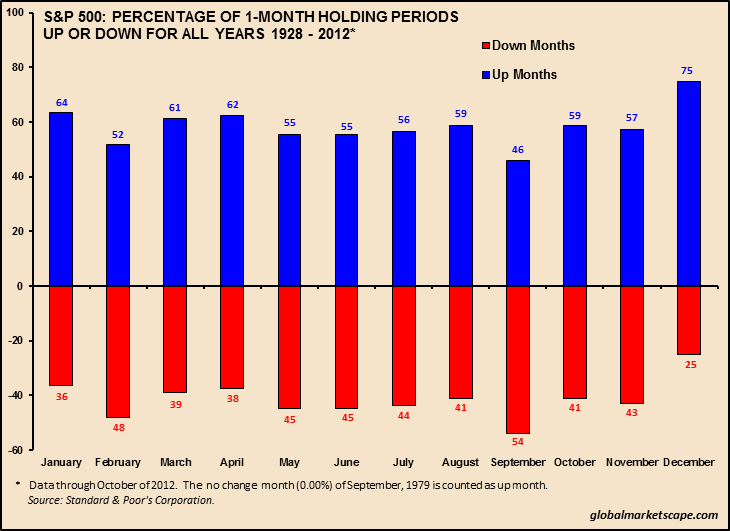
October jinx-- October has a special place in the financial calendar, and it's commonly believed in the financial world to be the most fearful month, as historically it has been prone to more crashes than any other month. Stock Traders' Almanac calls October the "jinx month." Since 1928, on average the S&P 500 has risen .4% during Octobers (see Fig. 3). In the same period, S&P 500 has risen 59% of the Octobers, gaining an average 4.0% (see Fig. 1 & Fig. 2). When it fell in Octobers, which is 41% of the time since 1928, the average decline was 4.8%. The events that have given October a bad name in more than 80 years since 1928 are:
- Black Tuesday, Thursday and Monday, which gave rise to a combined decline of 19.9% during the stock market crash of October 1929.
- The financial meltdown on the Black Monday of October of 1987, giving a loss of 21.8% for the month primarily from the domino effect arising from program trading.
- The scariest 19-day mayhem of the 2008 financial crisis also occurred in the month of October, with a decline of 16.9% for the S&P 500 during the month.
December and January -- Of course, there are some effects named after these months as well - "Santa Claus effect", the "December effect", and the "January effect". Keeping aside these anomalies, the study revealed that since 1928 Decembers have been up 75% of the time vis-à-vis Januarys, which have been up 64% of the time (see Fig. 1). Thereby, we can deduce that Decembers have declined only 25% of the time compared to the 36% of the time during Januarys. The average gain in Decembers since 1928 is 3.0% compared to that of 4.2% in Januarys, while the on average the decline is 3.1% and 3.8% respectively (see Fig. 2). The average return of Decembers for more than eighty years has been 1.5% tying for the first spot with Julys (see Fig. 3), while Januarys (as well as Aprils) returned an average 1.2%. The number of two-digit monthly declines in Januarys since 1928 is zero, whereas Decembers have registered a one two-digit decline, of 14.5% in December 1931 (see Fig. 4, Fig. 5 and Fig. 6).
Sell in May and go away - If you look at Fig. 11, you can see that if you are fully invested in S&P 500 from November to April, and for the rest of the months in cash, a $1 invested in 1928 would have become $34.18 at the end of October of this year. Conversely, that is if you had fully invested in S&P 500 from May to October and stayed in cash for the rest of the months in the year, a $1 investment in 1928 would have become $2.34 at the end of October this year. Definitely, this result endorses the belief in "sell in May and go away." In fact, if you look at the figure closely, the effect has been more prevalent in the last forty or more years.
Otherwise speaking -- Januarys, Junes, and Augusts each have recorded the highest occurrences (four) of two-digit monthly increase by S&P 500 since 1928, closely followed by Octobers and Novembers with three each (see Fig. 7 and Fig. 8). Most of the highest occurrences of two-digit monthly increase or decrease by S&P 500 have occurred mostly during the depression era after the stock-market crash of 1929. It is likewise for the top-five increases or decreases of S&P 500 in a month since 1928 (see Fig. 6 and Fig. 9). The annualized volatility of monthly returns since 1928, segregated by months, have been identified in Fig. 10, and it shows that volatility of monthly returns for more than last 80 years has been the highest for Augusts at 21.6% followed by Aprils and Octobers at 21.3%.
As an analyst I would take this study with a pinch of salt, as the time-frame covered - 1928-2012 - is a long time, the underlying variables like trading rules and technology have gone a sea change in the intervening period. With the coming of information age in the sixties and rapid technical innovations in the realm of information technology and financial products, market efficiency has definitely improved in the last forty years or so. So comparing monthly returns across more than eight decades is not entirely a worthwhile exercise, but it would be interesting if we rerun the same study for the last five decades or so and draw conclusions. Doing such an exercise would also capture purely the real-time performance of S&P 500 from March 4th 1957, when the index came to existence as alluded to earlier, and exclude the effect of the mathematically imputed fictitious returns for periods prior to 1957. My next article would replicate this study for the time period starting from 1960 and analyze the results.
Conclusion: Albeit we do not have unequivocal evidence to conclude that certain individual months are better than others for investing in S&P 500 as a whole, we do have compelling evidence that "Sell in May and Come Back in November" is a viable strategy for investors as we can see in Fig. 11. The month of May could be used as a time-trigger to underweight S&P 500 in investment portfolios, and likewise Novembers could be used to overweight S&P 500. There are some months that might look attractive for S&P 500, but it would be senseless to hazard an opinion at this juncture, as discussed earlier, the analysis is clouded by the volatility that was seen in the pre-war years. So, a study on the S&P 500 from 1960 should yield conclusive results.


