The professional investors must profit by anticipating future trends and events rather than chasing old news. This is done by following the invisible hand or message of the market. That message, the simultaneous study of the the cycle of accumulation and distribution (trend), the distribution, movement, and participation of leverage (leverage), time/cycles, and human behavior void of opinions is defined below:
Gold remains in cause within broader mark down phase.
Insights will be following interplay of price, leverage, and time closely to help recognize when cause, the accumulation of energy that fuels the next impulse within mark up or mark down for subscribers. Please join us.
Understanding Reviews provides a detailed discussion of how to use and understand market reviews.
Trend
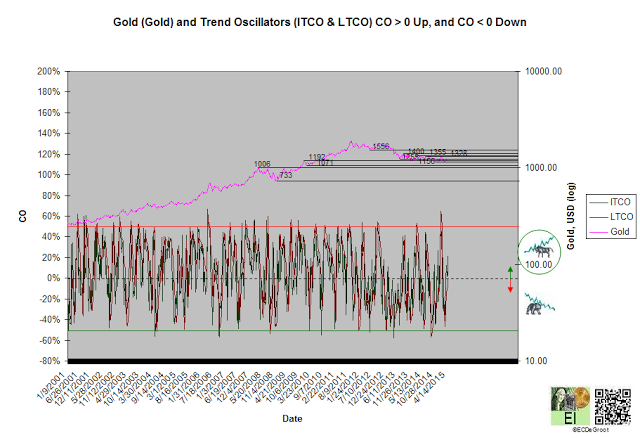
Positive trend oscillators define an up impulse and rally from 1209 since the fourth week of April (chart 1). The bulls control the trend until this impulse is reversed. While impatient bulls chase the fledgling rally, they do so without confirmation. Gold's composite timing index, a composite of price and intermarket money flows, remains negative (chart). This bearish trend, a divergence with price, advises against chasing strength until confirmed.
A sustained close above 1255 jumps the creek and extends the rally. A close below 1156-1192 support zone confirms continuation of mark down. Gold's inherent volatility means could easily break either zone during a single trading session.
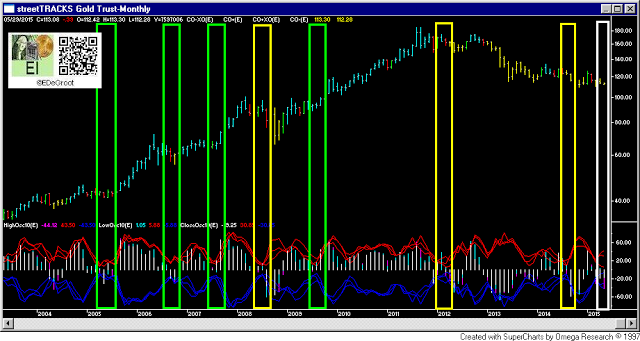
Trend compression suggests increasing volatility ahead (chart 1A). Experience traders recognize trend compression as a technical setup that leads expansion and price acceleration. Periods of low volatility (compression), for example, lead periods of high volatility (expansion), and vice versa. Even tighter compression in silver confirms this message. Insights will be tracking volatility for signs of expansion in the coming weeks. Expansion, a mathematical expression of price jumping the creek or breaking the ice from cause, separates BW and -BW (chart 1A).
Chart 1
Chart 1A
Leverage
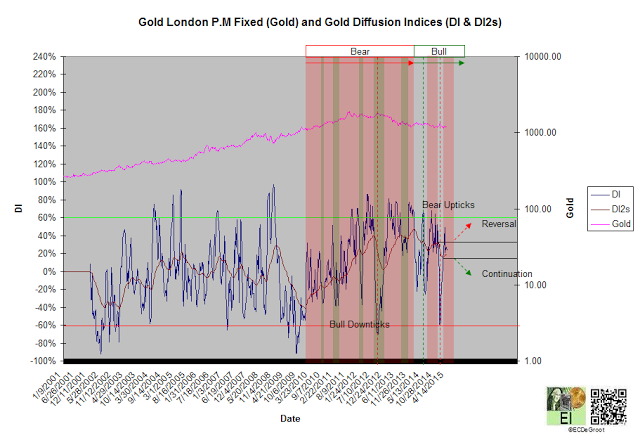
The flow of leverage defined a new bull phase or negative flow of leverage since August 2012 (chart 2). A DI2 close above its December high reverses the phase (red arrow). A DI2 close below its March low confirms continuation (green arrow).
Chart 2
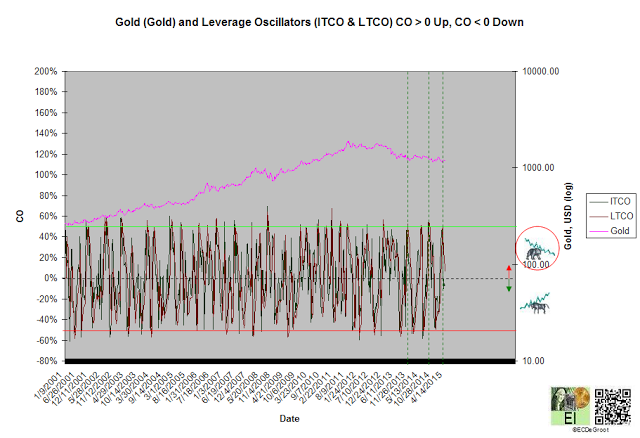
Positive leverage oscillators define an up impulse that supports the bear uptick (within bull phase) and trend (chart 3). These impulses often continue to oversold, green dotted lines marking extreme positive concentration. Oversold trend have consistently marked the approach of trading lows.
Chart 3
Time/Cycle
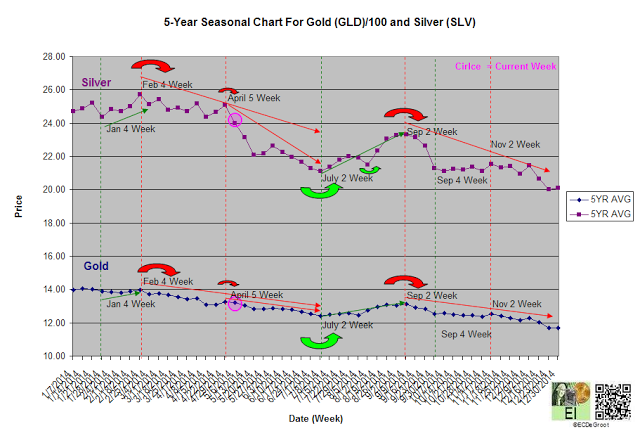
The 5-year seasonal cycle defines an slight upward drift until the fifth week of April (chart 4). After that, the seasonal cycle defines weakness until the July transition. Time, the driver of price and leverage, advises caution for the bulls.
Chart 4
- English (UK)
- English (India)
- English (Canada)
- English (Australia)
- English (South Africa)
- English (Philippines)
- English (Nigeria)
- Deutsch
- Español (España)
- Español (México)
- Français
- Italiano
- Nederlands
- Polski
- Português (Portugal)
- Português (Brasil)
- Русский
- Türkçe
- العربية
- Ελληνικά
- Svenska
- Suomi
- עברית
- 日本語
- 한국어
- 简体中文
- 繁體中文
- Bahasa Indonesia
- Bahasa Melayu
- ไทย
- Tiếng Việt
- हिंदी
Gold Remains Within Broader Mark Down Phase
Published 05/04/2015, 07:02 AM
Updated 07/09/2023, 06:31 AM
Gold Remains Within Broader Mark Down Phase
Latest comments
Loading next article…
Install Our App
Risk Disclosure: Trading in financial instruments and/or cryptocurrencies involves high risks including the risk of losing some, or all, of your investment amount, and may not be suitable for all investors. Prices of cryptocurrencies are extremely volatile and may be affected by external factors such as financial, regulatory or political events. Trading on margin increases the financial risks.
Before deciding to trade in financial instrument or cryptocurrencies you should be fully informed of the risks and costs associated with trading the financial markets, carefully consider your investment objectives, level of experience, and risk appetite, and seek professional advice where needed.
Fusion Media would like to remind you that the data contained in this website is not necessarily real-time nor accurate. The data and prices on the website are not necessarily provided by any market or exchange, but may be provided by market makers, and so prices may not be accurate and may differ from the actual price at any given market, meaning prices are indicative and not appropriate for trading purposes. Fusion Media and any provider of the data contained in this website will not accept liability for any loss or damage as a result of your trading, or your reliance on the information contained within this website.
It is prohibited to use, store, reproduce, display, modify, transmit or distribute the data contained in this website without the explicit prior written permission of Fusion Media and/or the data provider. All intellectual property rights are reserved by the providers and/or the exchange providing the data contained in this website.
Fusion Media may be compensated by the advertisers that appear on the website, based on your interaction with the advertisements or advertisers.
© 2007-2024 - Fusion Media Limited. All Rights Reserved.

