Peso should reach 15.0 within next year and 17.0 within next several years.
Note: I am a chartist. I do not take into account macro economic forces. I do not watch Bloomberg or read the WSJ or Barrons. I do not read much published research. I especially do not watch #CNBC. People who rely on CBNC for their business news are extremely hard up for objective thinking. CNBC is a comedy entertainment and should not be taken as serious by serious market participants. CNBC is basically a “news” network where reporters take themselves as serious market commentators. This is what makes CNBC so funny.
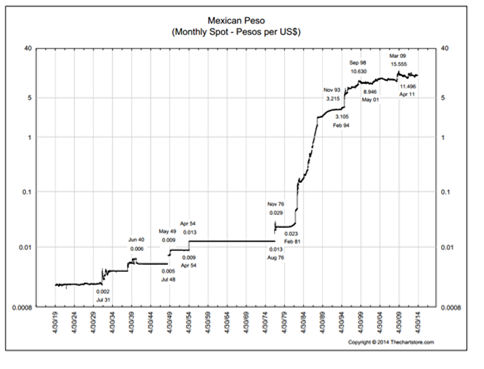
The longest term chart shows that the Peso has been in an historical trend of depreciation against the USD. The charts below shows the exchange rate — the number of Pesos required to purchase one USD. When I started trading the Peso at the IMM in the 1970s, the Peso was at a premium to the USD.

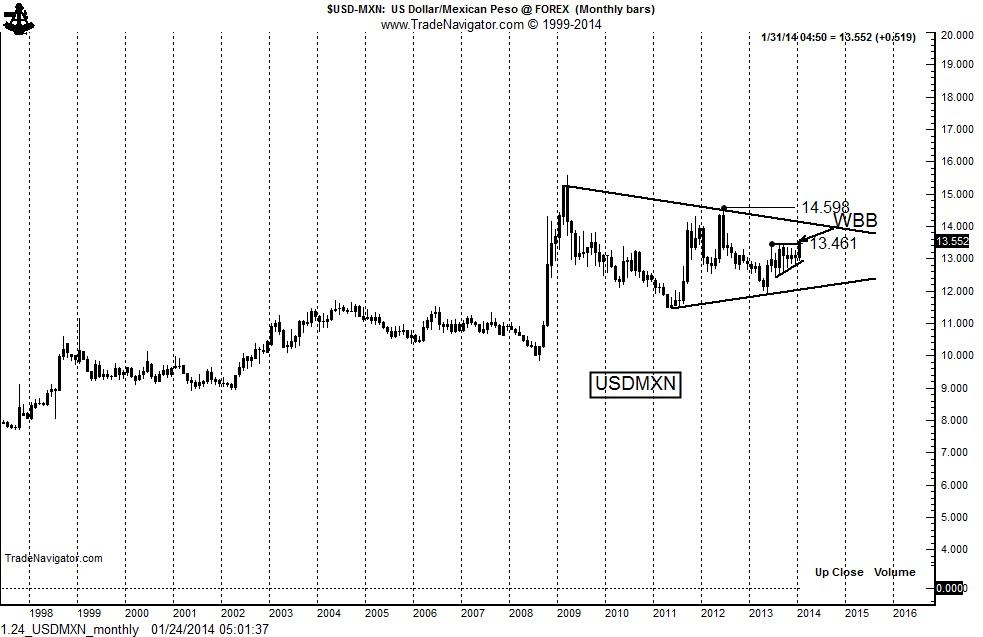
The Peso is coiling within a 5-year symmetrical triangle on the monthly chart. The key challenge within this triangle will be the 14.50 to 15.00 level. A clearance of this level will indicate that much greater depreciation of the Peso against the USD would occur — very possibly a move to 17.0 to 18.0. The last period of substantial depreciation was in late 2008. I am looking for a similar move within the next year or two.

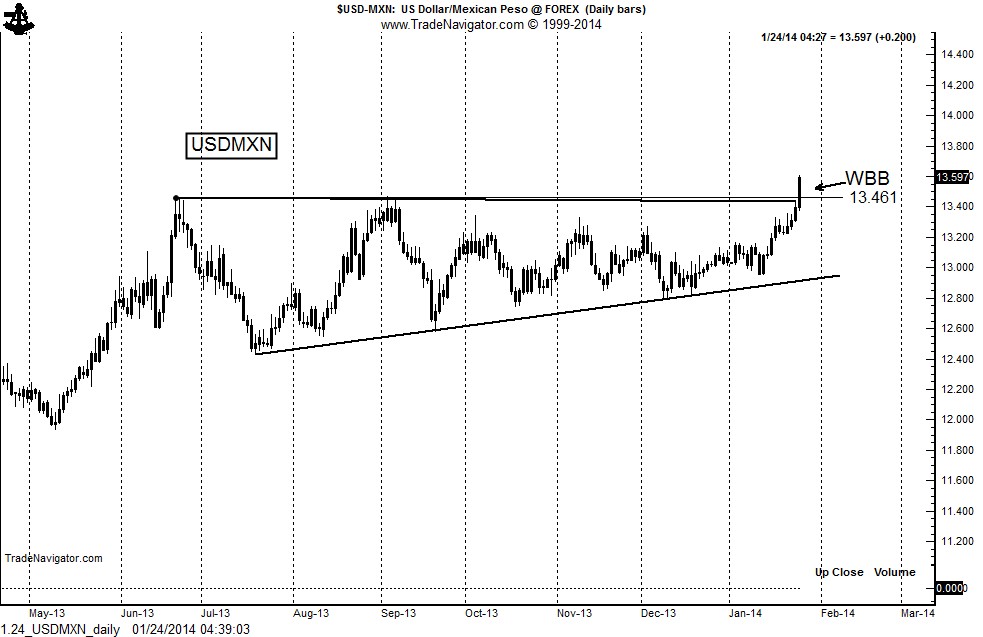
The daily chart shows that the jump today has resolved a 7-month trading range. If today’s move in the USDMXN holds (a big if — it is 03:15 Mountain US time), it will prove to be the blast off in the next phase of Peso depreciation.
The information in this blog post represents my own opinions and does not contain a recommendation for any particular security or investment. I or my affiliates may hold positions or other interests in securities mentioned in the Blog, please see my Disclaimer page for my full disclaimer.

