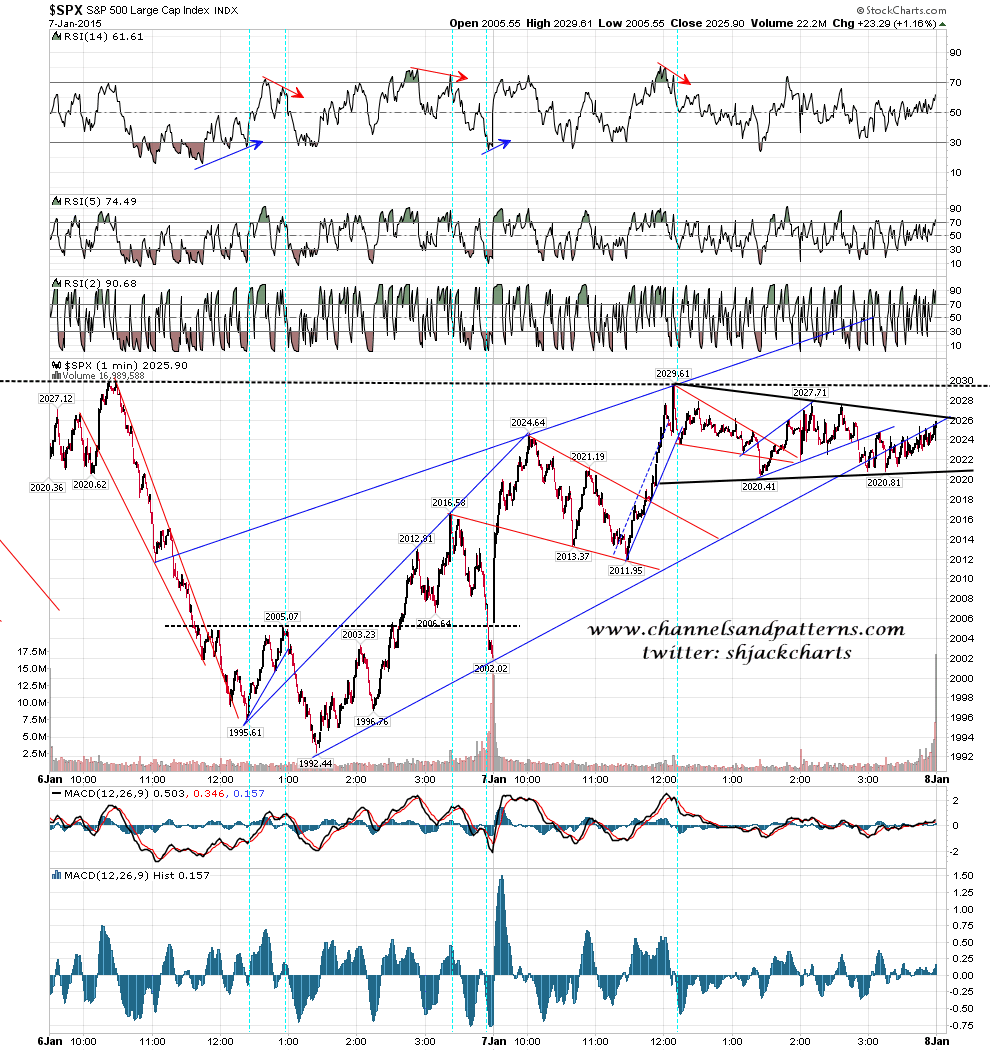
This has been a strange week, particularly yesterday, but direction should become clear this morning, and unless the bears can dominate the first hour enough to fill the (currently +17) opening gap, then that direction is likely to be up to pattern targets starting in the 2067 area.
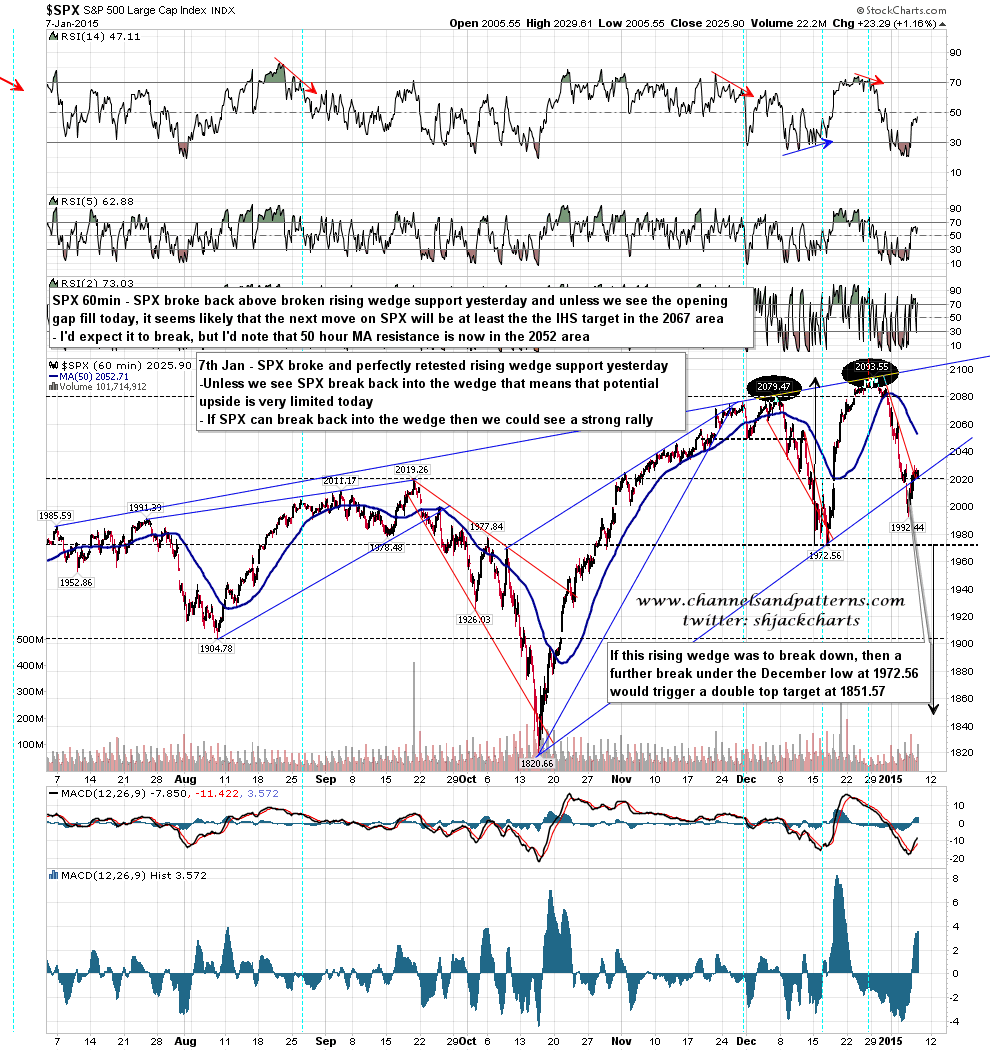
The situation here is unusually complex, but I’ll break it down into the component parts to explain it. The bigger picture is of course the rising wedge from the 1820 low that broke down on Tuesday. Now the first thing I look for when a wedge like this breaks support is a topping pattern, generally either a double top or an H&S. I wasn’t looking for one here because there is already a very decent quality double top formed here, but it seems that we may well be about to retest the highs in order to form another (smaller) double top here as well, or (less likely in my view but worth bearing in mind) to break up from this rising wedge with a target somewhere in the (cough) 2350 – 2400 area.
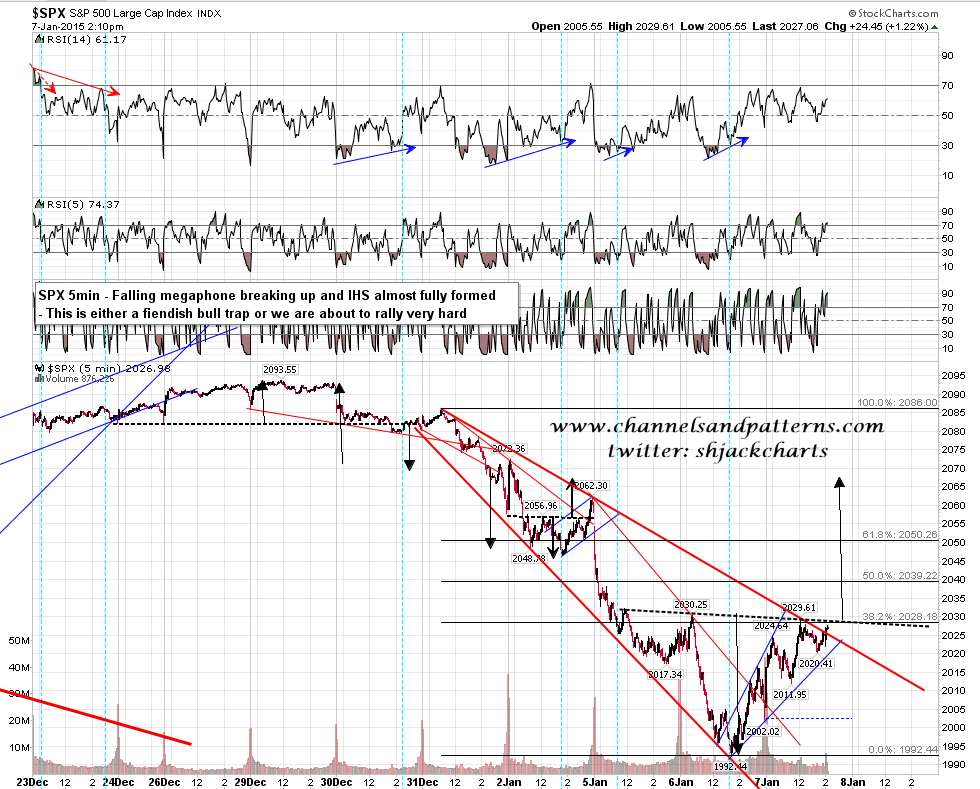
The bull setup here, as posted by me on twitter yesterday afternoon, is that a falling megaphone from 2086 has formed and broken up. An IHS has also formed which would target the 2067 area on a sustained break over 2028. At the time of writing ES is suggesting an open in the 2042 area so that would be a big breakaway gap over IHS neckline resistance, which as long as that gap is not filled, is the most bullish way in my view to break over a strong resistance level.
However unusually there is also a very decent bear setup here, and I posted that on twitter a bit later on yesterday afternoon when the rising wedge from Tuesday’s low broke down. The break spent the rest of the afternoon retesting, and if we were to see a fast fill of the opening gap, ideally from an open in the 2027-2035 area, this break would then be backed up by a decent double top looking for the 2010 area on a break under the 2020 area. If that were to happen then the break up on the megaphone might have been a bearish overthrow, and the pattern setup would start to look very bearish indeed.

I’m not expecting that though, and I’d add that in the event of a break up here, then that break down from the rising wedge yesterday would be a bullish under throw, and on a subsequent break over wedge resistance, now in the 2040 area, then that would target a retest of the current all time highs.
I’d call the odds as 75/25 in the bulls’ favor this morning, and that would be higher for the bulls if this hadn’t been such a strange week. If the overnight gap up holds then we may well see a trend up day and I wouldn’t be that surprised to see the IHS target at 2067 SPX made today.
In the less likely event that the gap fills and SPX breaks down then there is a very good chance that we would see a trend down day instead and might well then test or break Tuesday’s low. I would say here that short positions are extremely high risk here unless the opening gap fills, and that long positions would become extremely high risk if that gap did fill. Anyone who isn’t an adrenalin junkie might want to wait until after the first hour of trading to trade this, by which time I would expect direction to be clearer.


