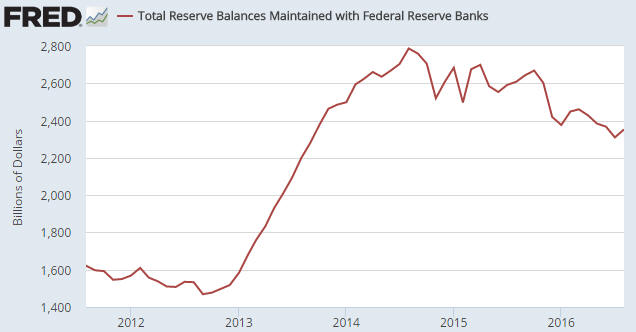
The following chart shows that on a monthly closing basis, bank reserves held at the Fed peaked in August of 2014 at $2.79T and by August-2016 had shrunk to $2.35T. This amounts to a $440B decline in bank reserves over the space of two years.
Furthermore, $320B of this $440B decline happened since last October. Does this mean that while the financial world vigorously debates whether the Fed will/should take a ‘baby step’ along the rate-hiking path next week, behind the scenes the Fed has been tightening the monetary screws for 2 years and especially over the past 10 months?

In a word, no. Up until now the Fed has done nothing to tighten monetary conditions.
I am, of course, aware that there was a tiny increase in the Fed’s targeted interest rate last December, but this rate hike was not implemented via a money-supply or reserve reduction and therefore did not constitute genuinely-tighter monetary policy. What, then, is the explanation for the significant reduction in bank reserves held at the Fed?
Before getting to the explanation I’ll reiterate that there are only three ways for US commercial bank reserves to decline. They can be converted to physical currency in circulation in response to increasing demand on the part of the public for notes and coins, they can be shifted to other accounts at the Fed, or they can be removed by the Fed. Only the last of these constitutes monetary tightening by the Fed.
Part of the explanation for the decline in bank reserves is the increasing demand on the part of the public for notes and coins. Due to “inflation”, this demand increases almost every year and is satisfied by the conversion of reserves into physical currency. This naturally has the effect of reducing bank reserves, but the process does not change the money supply because the physical currency replaces electronic currency. For example, when you withdraw $100 at an ATM, $100 is converted from electronic form to paper form while the total money supply is obviously unaffected. This $100 of ‘paper’ comes from the bank’s reserves.
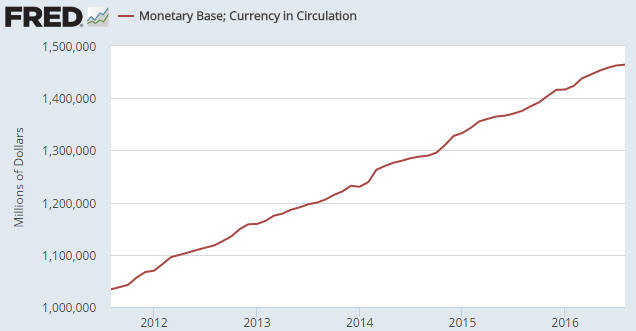
The following chart shows the steady increase in “Currency in Circulation” over the past 5 years. As noted above, this increase involves the siphoning of reserves (in physical form) out of the banking system to replace electronic money. An implication is that if the Fed does nothing and the public’s demand for physical notes/coins is rising, bank reserves will dissipate over time.

Since last October, when the rate of decline in bank reserves accelerated, “Currency in Circulation” has risen from $1392B to $1464B, or by $72B. In other words, increasing demand for physical notes/coins only explains $72B of the $320B reduction in reserves since last October. If the remaining $248B reduction wasn’t due to the actions of the Fed, what caused it?
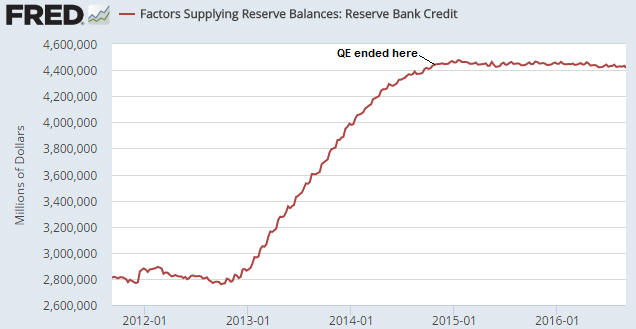
Before I answer the above question I’ll provide evidence that the reserve reduction wasn’t engineered by the Fed. The evidence is the following chart showing total Federal Reserve Credit. Notice that Total Fed Credit has flat-lined since the end of QE in October-2014. This indicates that since October-2014 the Fed has not made any sustained additions to or deletions from the quantity of money or the quantity of bank reserves.

Getting back to the question asked above, the answer is the US Treasury. More specifically, about 90% of the remaining $248B reduction in bank reserves has been caused by the US Treasury hoarding a lot more cash than usual at the Fed.
As I mentioned earlier in this piece, bank reserves can’t leave the Fed unless they are removed by the Fed or get converted to physical currency in response to increasing public demand for notes/coins, but they can get shifted to other (non-reserve) accounts at the Fed. One of these accounts is called the US Treasury General Account, which, as the name suggests, is the US government’s account at the Fed.
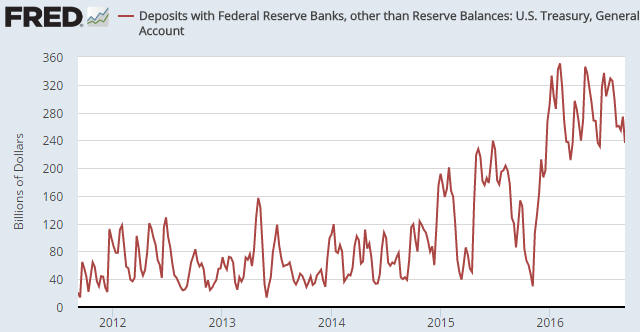
As illustrated by the following chart, the Treasury General Account was about $50B at the end of October last year and was about $275B at the end of August this year. This means that over the 10-month period beginning in November of last year, the US Treasury removed about $225B from the economy-wide money supply and removed the equivalent amount from bank reserves.
Just to be clear, the government removes trillions of dollars per year from the economy, but it normally recycles the money very quickly. Usually, money comes in one door via taxation or borrowing and immediately goes out another door. The difference this year is that the Federal Government has been maintaining a much higher ‘cash float’ than usual.

I don’t know why the US Federal government has suddenly started keeping a lot more cash in reserve. Perhaps the leadership wants to make sure that, come what may, there will always be plenty of ready cash to pay the salaries/benefits of politicians and senior bureaucrats.
