The market giveth and the market taketh away.
The intelligent investor does not allow themselves to be swept along with the rabble of the street (Wall Street, that is) when the market clearly gets ahead of itself. Instead they begin to take some chips off the table. In so doing, they will look foolish for a short time. We have. Get used to it. Being on the unpopular side of a trade that’s getting long in the tooth most often means you’re avoiding a burgeoning fiasco.
The same is true on the other side of the equation, of course. When you hear formerly exuberant amateur traders bemoan the fact that they’ve lost everything and are never going to buy another stock again, start buying. The smart money is buying. They’ll be followed by the insiders, then the professionals and the bravest of individual investors, then the bulk of the buying public.
So how do you know when you are reaching the point when it’s wise to take something off the table? The best way is non-quantitative. When you think you, or your broker, is the smartest person in the room, it’s probably time for a wake-up call. But when you see charts like those below, that’s often a pretty good hint, as well. If a picture is worth a thousand words… 
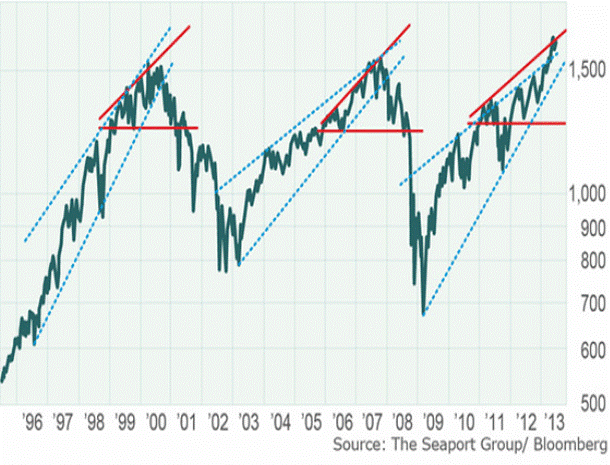
This first chart is a macro snapshot of where we are in the scheme of things over the past 18 years. We’ve been here before. That doesn’t mean history will repeat, but as Joseph Wittreich wrote, “History does not repeat itself, but it rhymes.” [Often, in this age of the lazy blogger, mis-attributed to Mark Twain.]
Of course, just because the S&P 500 penetrated 1500 in April 2000, hung around there for a few months and then plunged, and just because the S&P 500 penetrated 1500 in May 2007, hung around there for a few months and then plunged, that doesn’t guarantee we will do so now. After all, one of these days, it will decisively roar ahead, signaling the end of the secular bear market we’ve been in for 14 years (as the chart above rather clearly shows; after up-down-up-down and mostly sideways, we are now barely ahead of where we were in 2000.)
Of course you could have made money by picking the top and bottom of the shorter--cycle bull markets during this time — we try to, and that’s why we have placed trailing stop orders under many of our positions. We could be wrong, in which case we will lose some amount of opportunity. Let’s say we miss the first 100 S&P points; those 100 points will be a pittance compared to the ultimate profit if this is the year we break out to the upside.
What are the odds of that happening? Anything can happen, but somehow I just don’t see the big secular bear ending with a market supported 100% by fiscal and monetary crack cocaine delivered by our favorite pushers, Congress and the Fed; with households’ actual purchasing power essentially flat; with 7.6% unemployment; with the Chicago Fed’s NBAI (National Business Activity Index) scraping along the bottom; with previous reports of GDP growth being revised downward; with pre-warnings from most companies (93 of 116) showing downward revisions of earnings; and with a market that is at what some would call a triple-top and which I’ll just note is again at what is clearly an area of interest. I’m a perennial optimist and I see the good news out there, as well. I know that at some point, we’ll see another great bull super-cycle. But if Rule #2 for me is “Remain an optimist on the US economy and markets,” Rule #1 is “Buy when others are selling; not in the midst of a frenzied fear of missing something.” (And a good Rule #3 is: “Don’t overlook the obvious.”)
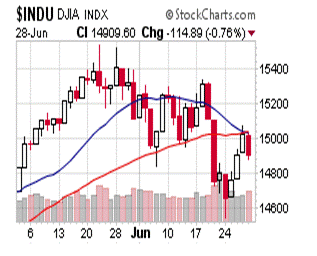
I love to ride the roller-coaster at theme parks. But I don’t like roller-coaster investing. Both the chart above and the one below, showing recent day-to-day action in May and June, resemble nothing so much as a scary (and tough to trade and typically unprofitable) roller-coaster.
This kind of market volatility “can” occur at any time but it is most prevalently seen at market bottoms and market tops. If I had to pick one, I’d say we’re closer to the latter than the former.
The contrast I draw for our clients and subscribers is between “roller-coaster investing” and “fjord investing,” which is more our style.
On the other hand, researching the best information, analyzing where we are in the big and small cycles, and moving in a measured and discipline manner (what we aspire to do always) looks more like my #1 research assistant hard at work in a serene setting – not frenetically trading in and out and biting nails over the latest whisper from the Fed, but actually reading a financial document and thoughtfully reacting to it.
Sounds pretty calming, doesn’t it? I say, save the roller-coaster for the theme park; you’ll sleep better and you won’t eat any worse...
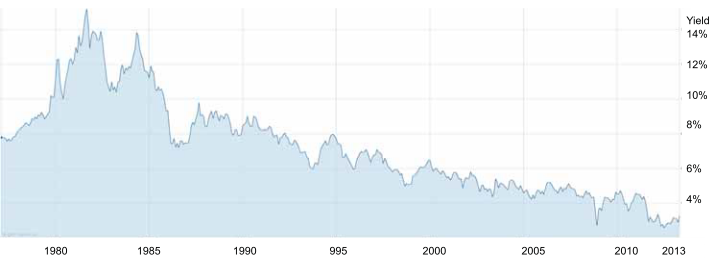
Where does our Fjord Investing® lead us to these days? We look for the most obvious wherever and whenever we can. Right now, there is simply no question in my mind that interest rates will rise in the United States.  If we were to enter a massive deflationary / depression period, of course, rates would decline. But if you’ve seen the price of a college education, or gasoline, or food, or just about anything lately, you might come away thinking that the timeless cycles of deflation and inflation augur for inflation right now, not deflation. Following Rule #3 above, we are buying the ProShares Short 20+ Year Treasury ETF (TBF) for our more conservative clients and the ProShares UltraShort 20+ Year Treasury ETF (TBT) for most. No matter whether the market roars ahead or slides back down, the other side of the top of the roller-coaster, I believe we will make money betting that interest rates will rise, lessening the value of existing US Treasury bonds.
We are not, however, panicking about all bonds or all dividend-paying stocks. Short-duration bonds, convertible bonds of growth companies, and value stocks that pay a good dividend all fell off in concert with The Great Bond Panic of June 2013. That’s just silly. I also see some nice bargains in real estate investment trusts (REITs), energy and agriculture that have sold off to the point where they pay 5% and 6%. Unlike bonds, all of these have the ability to raise their rentals and selling prices of their product when inflation shows itself in the official numbers (like it already does in your and my expenses.) I’ll discuss some of those in my next Investing.com article…
THE FINE PRINT: As Registered Investment Advisors, we see it as our responsibility to advise the following: we do not know your personal financial situation, so the information contained in this communiqué represents the opinions of the staff of Stanford Wealth Management, and should not be construed as personalized investment advice.
Past performance is no guarantee of future results, rather an obvious statement but clearly too often unheeded judging by the number of investors who buy the current #1 mutual fund only to watch it plummet next month.
We encourage you to do your own research on individual issues we recommend for your analysis to see if they might be of value in your own investing. We take our responsibility to proffer intelligent commentary seriously, but it should not be assumed that investing in any securities we are investing in will always be profitable. We do our best to get it right, and we "eat our own cooking," but we could be wrong, hence our full disclosure as to whether we own or are buying the investments we write about.
- English (UK)
- English (India)
- English (Canada)
- English (Australia)
- English (South Africa)
- English (Philippines)
- English (Nigeria)
- Deutsch
- Español (España)
- Español (México)
- Français
- Italiano
- Nederlands
- Português (Portugal)
- Polski
- Português (Brasil)
- Русский
- Türkçe
- العربية
- Ελληνικά
- Svenska
- Suomi
- עברית
- 日本語
- 한국어
- 简体中文
- 繁體中文
- Bahasa Indonesia
- Bahasa Melayu
- ไทย
- Tiếng Việt
- हिंदी
Is It Time To Take Some Chips Off The Table?
Published 07/11/2013, 12:52 AM
Updated 07/09/2023, 06:31 AM
Is It Time To Take Some Chips Off The Table?
Latest comments
Loading next article…
Install Our App
Risk Disclosure: Trading in financial instruments and/or cryptocurrencies involves high risks including the risk of losing some, or all, of your investment amount, and may not be suitable for all investors. Prices of cryptocurrencies are extremely volatile and may be affected by external factors such as financial, regulatory or political events. Trading on margin increases the financial risks.
Before deciding to trade in financial instrument or cryptocurrencies you should be fully informed of the risks and costs associated with trading the financial markets, carefully consider your investment objectives, level of experience, and risk appetite, and seek professional advice where needed.
Fusion Media would like to remind you that the data contained in this website is not necessarily real-time nor accurate. The data and prices on the website are not necessarily provided by any market or exchange, but may be provided by market makers, and so prices may not be accurate and may differ from the actual price at any given market, meaning prices are indicative and not appropriate for trading purposes. Fusion Media and any provider of the data contained in this website will not accept liability for any loss or damage as a result of your trading, or your reliance on the information contained within this website.
It is prohibited to use, store, reproduce, display, modify, transmit or distribute the data contained in this website without the explicit prior written permission of Fusion Media and/or the data provider. All intellectual property rights are reserved by the providers and/or the exchange providing the data contained in this website.
Fusion Media may be compensated by the advertisers that appear on the website, based on your interaction with the advertisements or advertisers.
© 2007-2025 - Fusion Media Limited. All Rights Reserved.
