This week’s main event is supposed to be the FOMC meeting. Certainly, for some time now that has been the case: in a week with a Fed meeting, nothing else matters. Knowing this, many investors will probably over-parse the language from the FOMC statement following the meeting, even though there is little to no chance of any policy change at this meeting nor at any of the next few meetings (it certainly would be a huge surprise if the Fed were either to tighten, or even to indicate a growing likelihood of a future tightening, after Cleveland Fed President Mester recently mused about helicopter drops).
In the meantime, though, we have some housing data that is somewhat interesting. New Home Sales were released yesterday, showing a new seasonally-adjusted post-crisis high. To be sure, sales are still well off the bubble highs, but they are back to roughly average for the period prior to the bubble (see chart, source Bloomberg).
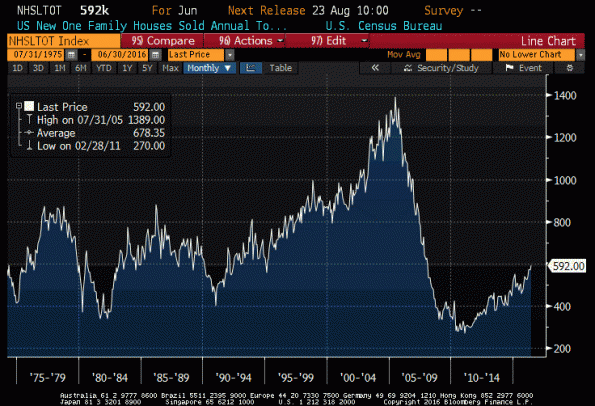
New Home Sales is more regular (outside of a bubble) than Existing Home Sales, because additions to the housing stock are partly driven by household formation and that’s reasonably constant over long periods of time. The more important number (in part because it is also much larger) is Existing Home Sales, which was released last week and looks even stronger (see chart, source Bloomberg).
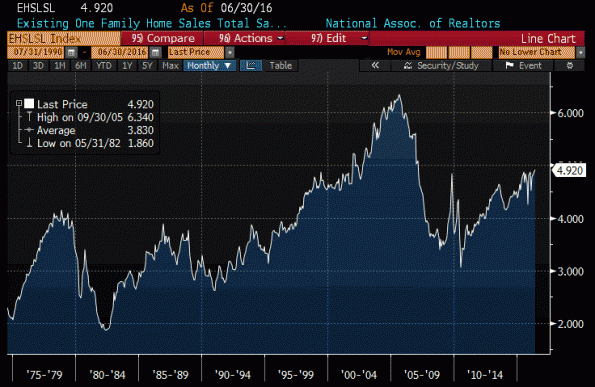
Existing Home Sales is also affected by household formation, but the level of the aggregate stock of housing matters as well, so this measure tends to rise over time. Even so, it looks to be at least back on the long-run trend.
Now, as an inflation scout I spend a lot of time looking at housing. Housing is the largest part of the consumption basket almost everywhere in the world, whether the shelter is owned or rented, and it is an even larger part of the more-stable core inflation basket. If you get housing right, in short, it is hard to be very wrong on inflation overall.
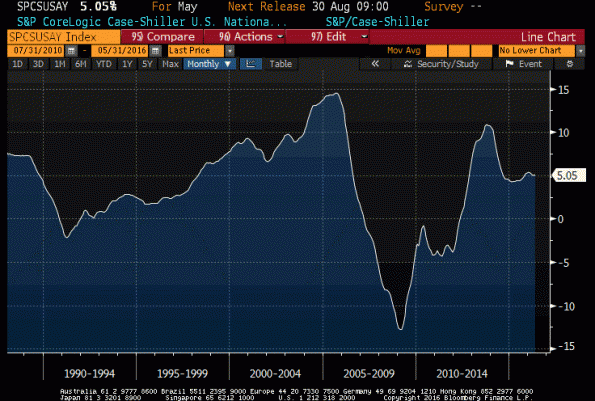
This is why I’ve been persistent in saying that deflation in the US, outside of the energy price collapse, isn’t coming any time soon. The rise of home prices in the US, as measured by the S&P CoreLogic Case-Shiller index (which becomes more of a mouthful every time someone new buys the index!), has eased to around 5% per annum versus a rebound-inspired 10% in late 2013/early 2014 (see chart, source Bloomberg).
Here is where it pays to be a bit careful. A simple-lag model would predict that rents and owners-equivalent-rents should shortly be declining from current 9-year high rates of increase. But logically, that can’t make sense – if home prices rose 5% forever, then obviously rents would eventually rise something like 5% per year as well.
This is a case for a distributed-lag model (even better would be distributed lags on real prices, reflecting the fact that if overall inflation rises then the same real home price increase would reflect a higher nominal home price increase, but there isn’t enough “exciting” inflation in the last couple decades of data to calibrate that well). And one simple such model, shown below (source: Enduring Investments), suggests that the current level of OER is sustainable even though it currently incorporates the lagged effects of that post-2013 deceleration.
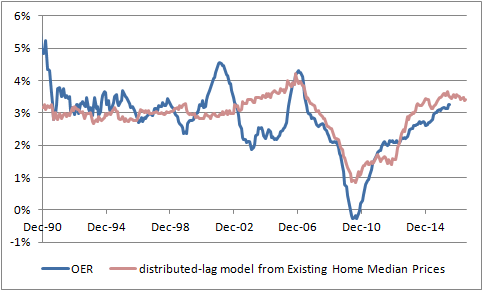
Now, of interest is that all of our models currently predict that rents will continue to rise for a bit, but only for a bit. Shelter inflation seems baked-in-the-cake through 2017, which is as far as our models project, but doesn’t seem to have a lot of acceleration left (maybe 0.25%) before leveling off. Having said that, there is another consideration that bears comment. The chart below (source: Bloomberg) shows the S&P CoreLogic CS Index again, this time plotted against the number of “Existing Homes Available for Sale” (and a 12-month moving average of that not-seasonally-adjusted index).
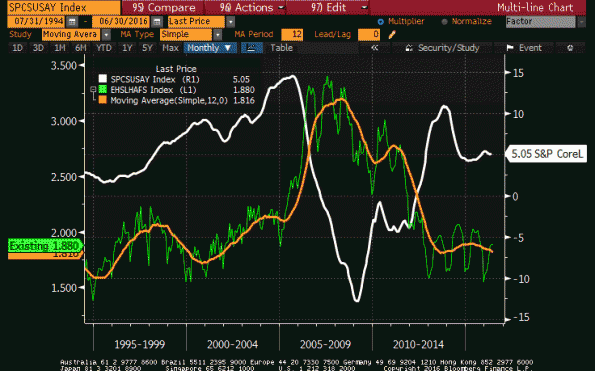
The relationship here is a bit loose, for a bunch of reasons, but the point to be made is this: the inventory of homes for sale has returned to levels that prevailed in the late-90s and early-00s, leading to home price increases in excess of the current 5%-per-annum level. When inventories first fell to this level, there was some fear that a large “shadow inventory” of homes that would have been sold at higher prices would be released into the market, holding down prices. If that has happened, it has been gradual as the inventory of homes actually listed has not risen appreciably in the last three years; moreover, it hasn’t held down home prices very well. The upshot is, I think, that home prices are likely to continue to rise by around 5% per year, or possibly faster; this will likely keep upward pressure on rents for the next couple of years.
But, as noted above, the upward pressure on rents will probably be limited from these levels, unless and until prices ex-housing begin to rise more aggressively. We expect them to do so; in any case, current CPI swaps quotes that imply core inflation will be at or below 1.5% for the next three or four years remain egregiously mispriced.
