The Healthcare sector has been one of the strongest performers during the bull market that began in 2009. It provided consistent relative outperformance while also holding the title as a reliable defensive sector gave many investors an increase in confidence at having exposure to this space inside their portfolios. However, recently, Healthcare's performance has begun to decline – notably due to the weakness experienced in the biotech industry.
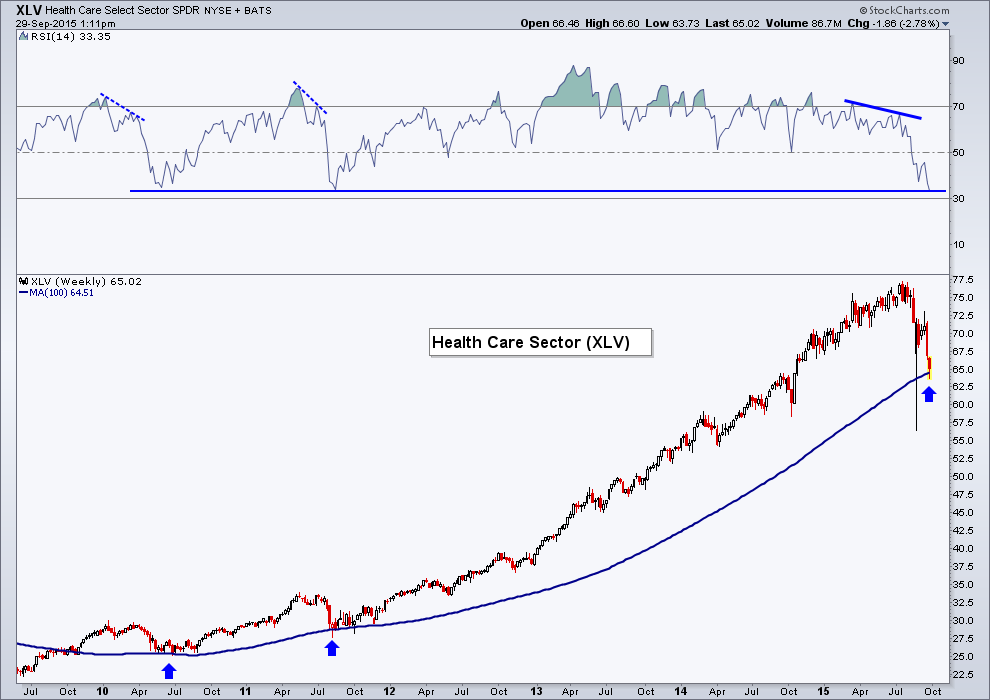
Below is a weekly chart of the Healthcare Select SPDR ETF (NYSE:XLV) going back to mid-2009. The setup here is quite simple… In 2010 and 2011 when the equity market as a whole sold-off, XLV found support at its 100-week Moving Average. Currently we have price back to this previously important level of support. Because this is a weekly chart I’m more concerned with where we close on Friday than I am with intra-week price movement.
Each of the prior declines in the Healthcare sector were preceded by a bearish divergence in momentum as shown by the dotted lines on the Relative Strength Index (RSI). The selling wasn’t strong enough to push the RSI indicator into ‘oversold’ territory; In fact both instances saw the indicator bottom out around 34.
This past summer we saw a bearish divergence created as XLV put in a higher high in price while momentum set up a lower high. Momentum is now back to the level that saw price bottom out in ’10 and ’11. Will the same type of bounce occur here?

