Investing.com’s stocks of the week
Before I even begin, allow me to define terms. Being bullish on the USD/MXN (spot) is the exact same thing as being bearish on the Mexican peso (which is actually expressed as MXN/USD in futures trading). USD/MXN expresses the number of pesos per USD. MXN/USD is the value of the peso in dollar terms.
As I write this, the USD/MXN is trading at 13.750X, or 13.75 pesos per one USD. The MXN/USD trades at a reciprocal of USD/MXN. Thus, 100 divided by 13.750 equals $.07273, meaning that a peso is worth just over 7 cents.
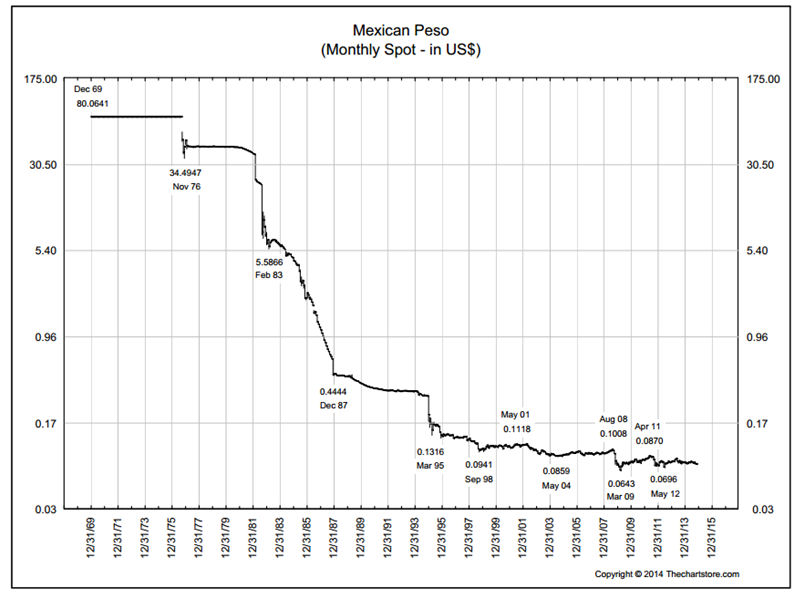
When I stared trading currencies at the IMM in the 1970s the peso was worth about $.8006. Thus, in just shy of 40 years the peso has declined in value against theUSD by 90%. The chart below reflects MXN/USD.
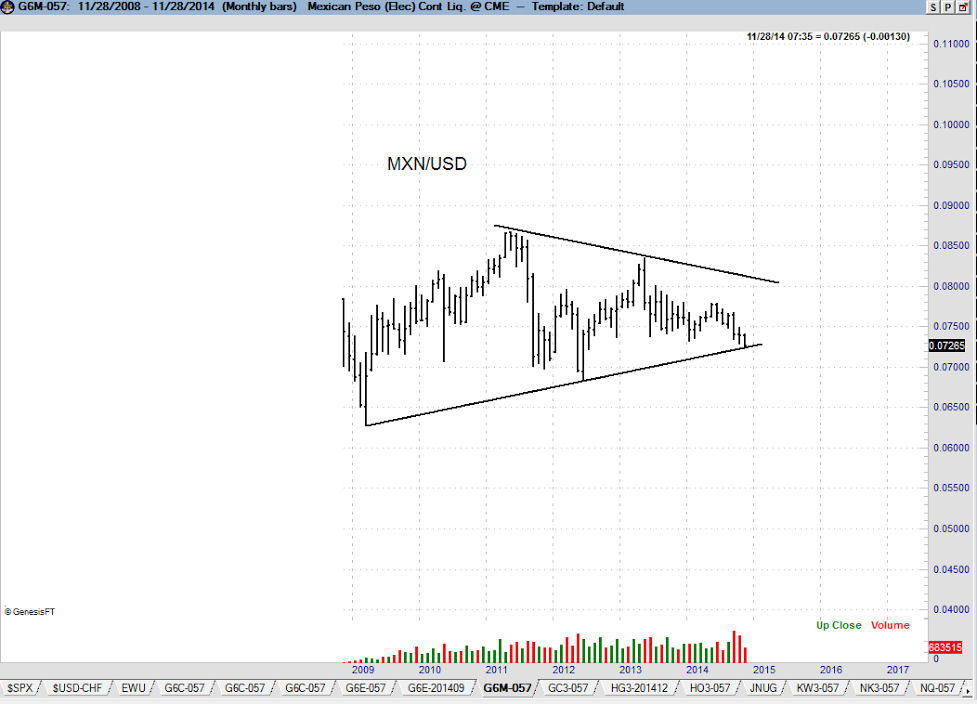
I believe the peso is due for another decline against the USD. The weekly graph of MXN/USD displays a possible 56-month symmetrical triangle.
My weekly graph of the USD/MXN goes back further, so the symmetrical triangle can be seen in better perspective.
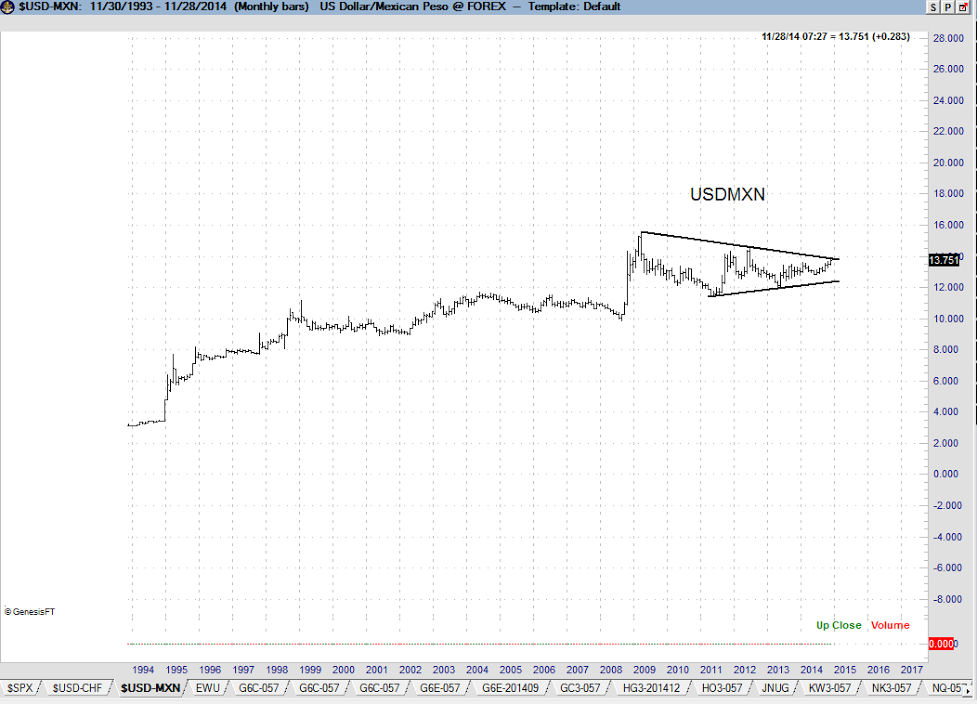
Remember, a bear move in the peso (MXN/USD) is the equivalent of a bull move in dollar/peso.
I have commented frequently on the potential for a much stronger USD/MXN (same thing as a weak peso) in recent months. My thought was that the peso will have another decisive leg down (this means bullish on USD/MXN) in 2015. Well, 2015 may be upon us. The lower boundary of the massive triangle is being challenged.
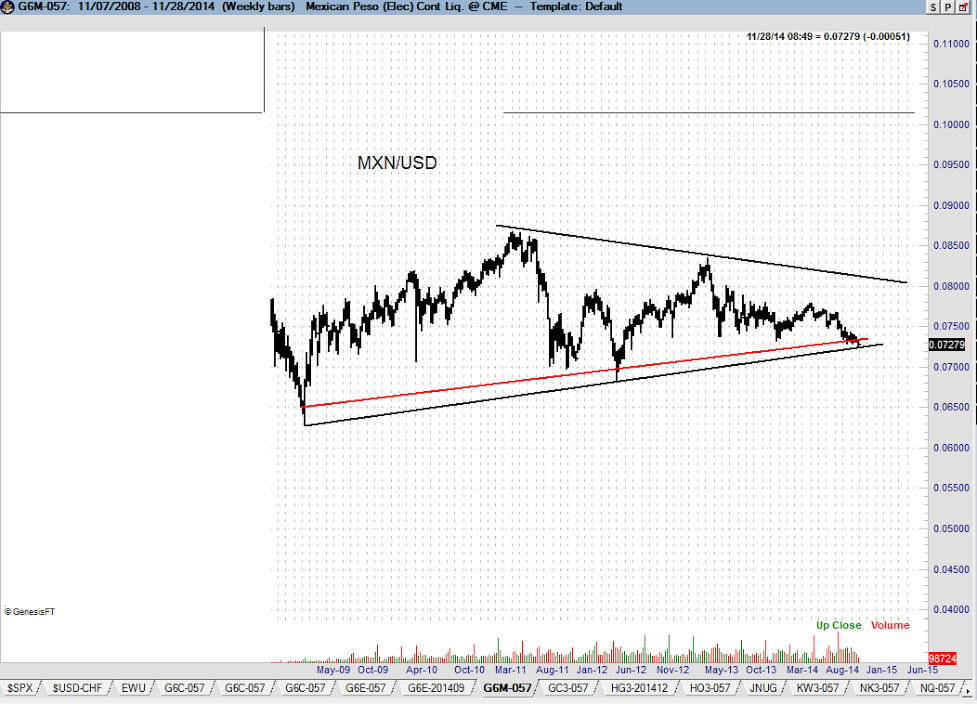
The daily chart shows the position of the price and the boundary line. Note the small 6-week descending triangle. 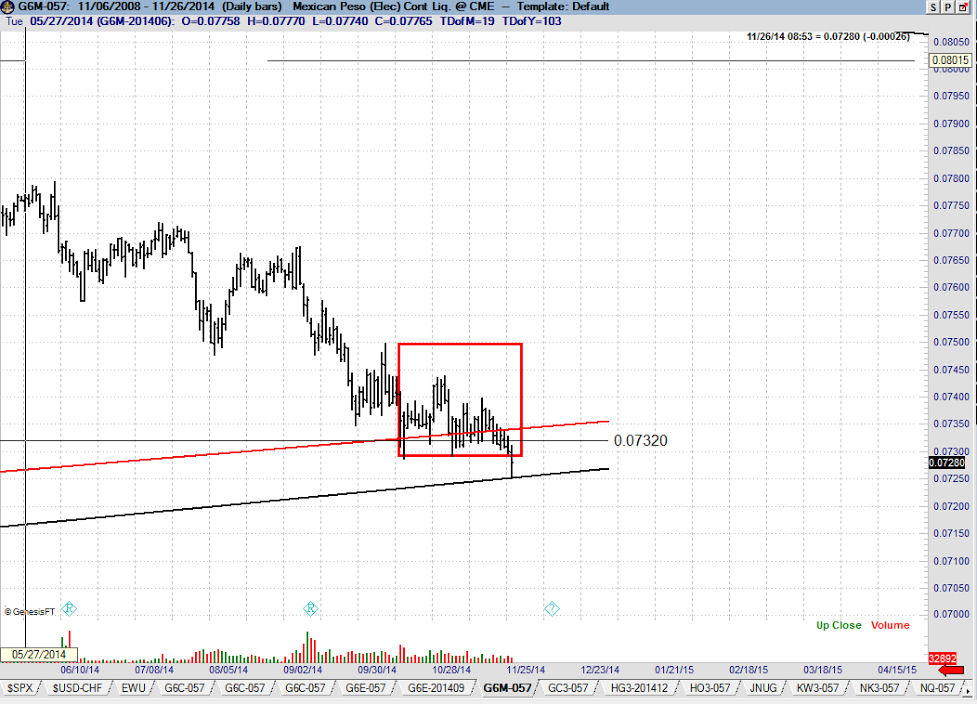
I am monitoring this market for a shorting opportunity. My target for the peso is toward $.0510
Disclosure: The information in this blog post represents my own opinions and does not contain a recommendation for any particular security or investment. I or my affiliates may hold positions or other interests in securities mentioned in the Blog, please see my Disclaimer page for my full disclaimer.
