All lights for gold are green, and rather than beginning a correction, gold may be poised to intensify its rally.
Investors with widely differing views on gold all seem to be pressing their buy buttons at the same time. That’s something that has not happened in a long time. The bottom line is this:
Key bank economists are forecasting a new upcycle for commodities, which will begin later this year, India may cut the import duty on Sunday night (February 28), Shanghai prepares to launch its gold price fix, gold ETFs are adding serious tonnage, the chartists are happy, and most discussion of US interest rate policy (whether hawkish or dovish) is bullish for gold.
Gold is arguably entering a period of time that is best termed as, “fundamental and technical nirvana”.
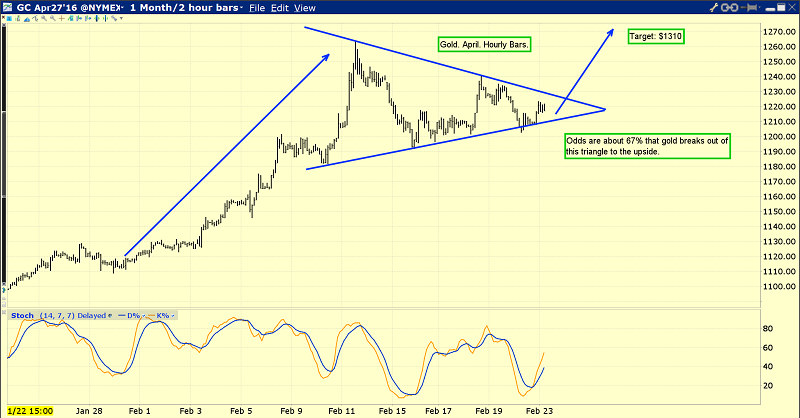
That’s a key gold chart, using two hour bars.
There’s a beautiful symmetrical triangle in play, with a rough upside target of $1310.
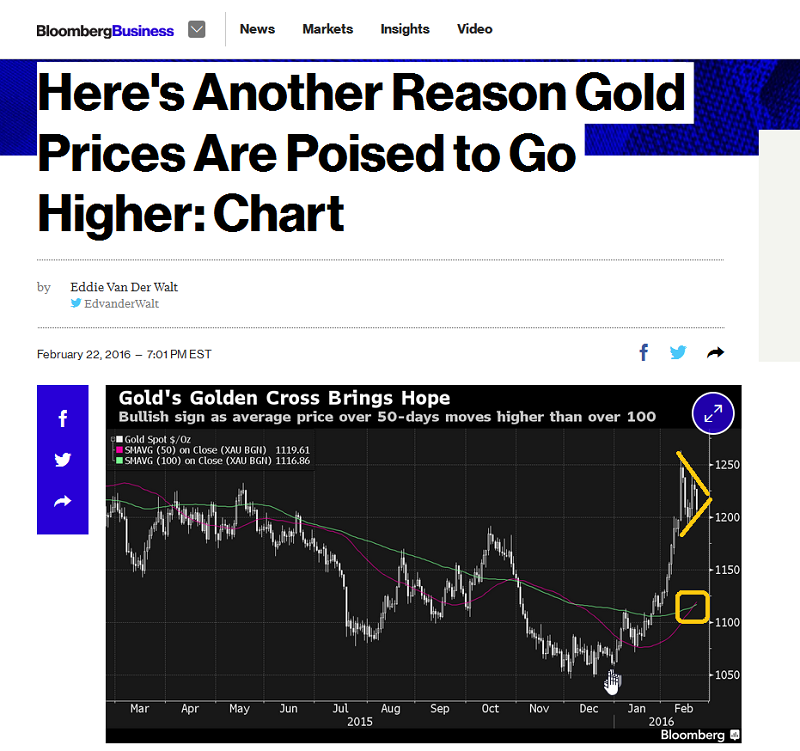
Mainstream chartists are also watching gold with great interest. Bloomberg News is covering a “golden cross” event, which occurs when the 50-day moving average crosses the 200 day moving average.
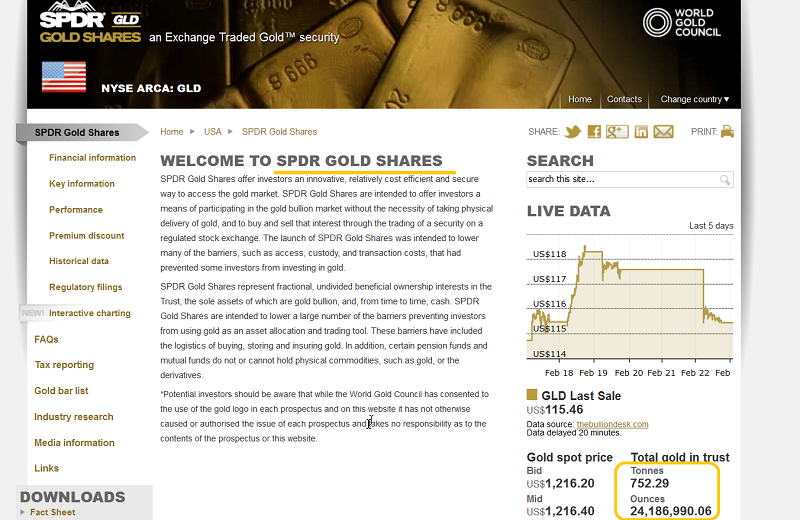
The widespread interest in gold is creating even more demand for this mightiest of metals! Investors have added an incredible amount of gold to the SPDR fund over the past few days, taking the total tonnage to over 750 tons.
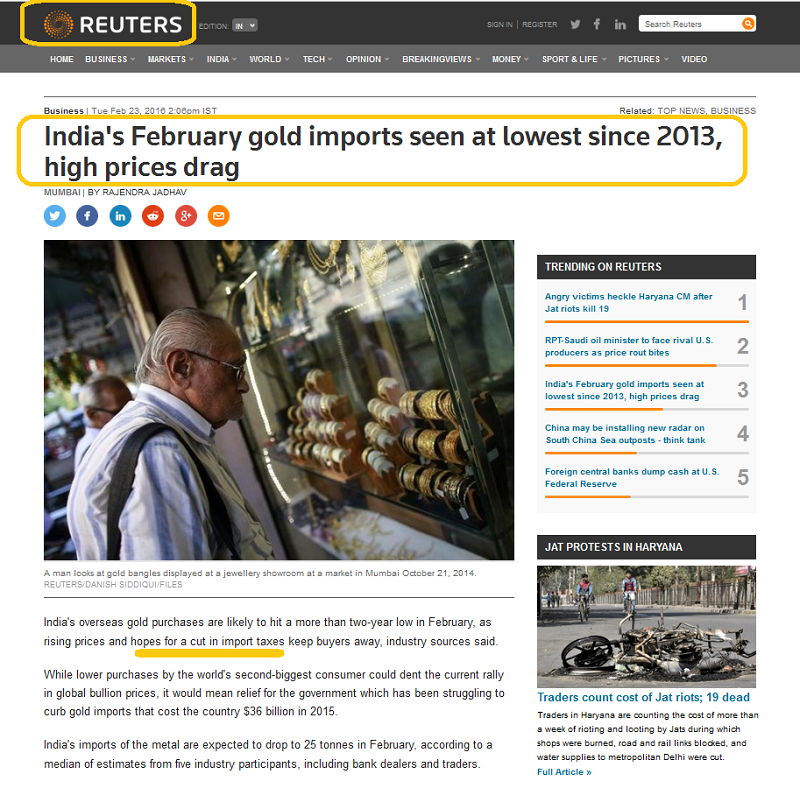
Indian demand has dropped dramatically in February, but that’s actually good news! The country’s national budget is scheduled for release on Sunday, and most of India’s top jewellers are predicting a cut in the import duty, which will be a key part of that budget.
If the duty cut happens, jewellers may buy gold aggressively, helping push the price to the triangle pattern target of $1310.
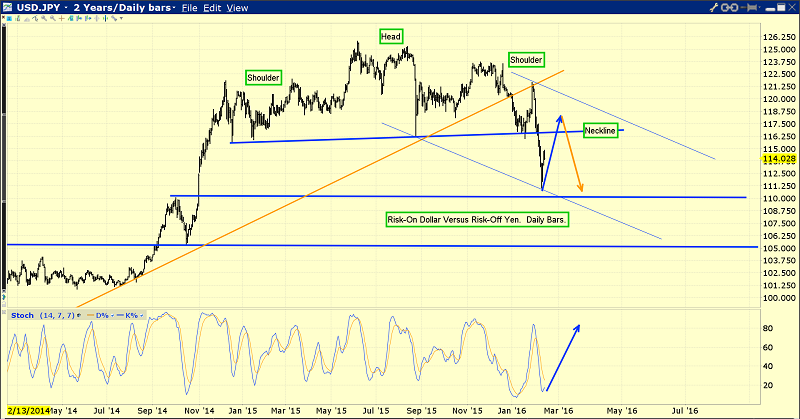
This dollar-yen chart is arguably the world’s most important chart for gold investors, in the intermediate term.
There’s a massive head and shoulders top pattern in play for the dollar, and if the dollar can’t stage even a modest rally against the yen, gold will not suffer the major correction that most analysts are waiting for.
If the dollar declines further against the yen, while an Indian duty cut occurs, gold could stage a powerful “overshoot” move, well beyond the $1310 target zone, and closer to $1400.
It’s likely an unspoken truth in the Western gold community, that almost every analyst was caught off guard by the enormous gold price rally that followed Janet Yellen’s interest rate hike. In contrast, I calmly predicted it. Most of these analysts are now trying to claim some kind of “final low” has appeared, and they are waiting to buy a correction.
Unfortunately, they may be left behind, holding little or no exposure to gold, as the rally not only continues, but intensifies.
If Janet Yellen doesn’t raise rates in March, it will cause institutional investors to buy gold, based on their view of a more dovish Fed.
If she does raise rates, it will cause an even bigger rally in gold, because it will cause a panic out of the dollar and global stock markets, into the yen and gold safe haven markets.
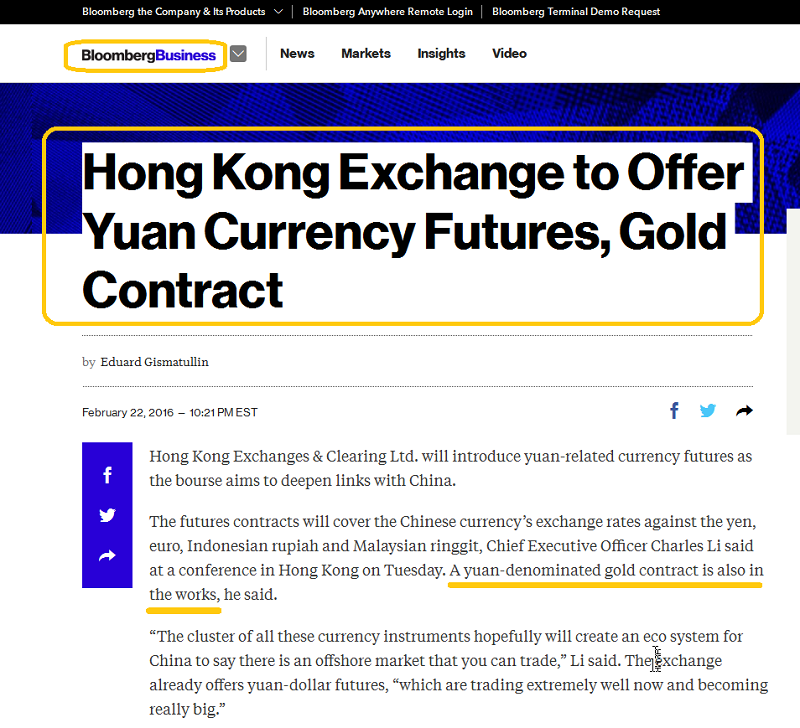
The good news for gold is starting to arrive faster than rabbits make babies. Hong Kong is a huge market, and one that is highly trusted by institutional investors.
As Hong Kong creates more partnerships with China, Western institutional investors will be keen to participate, creating even more demand for gold, as mine supply remains quite static.
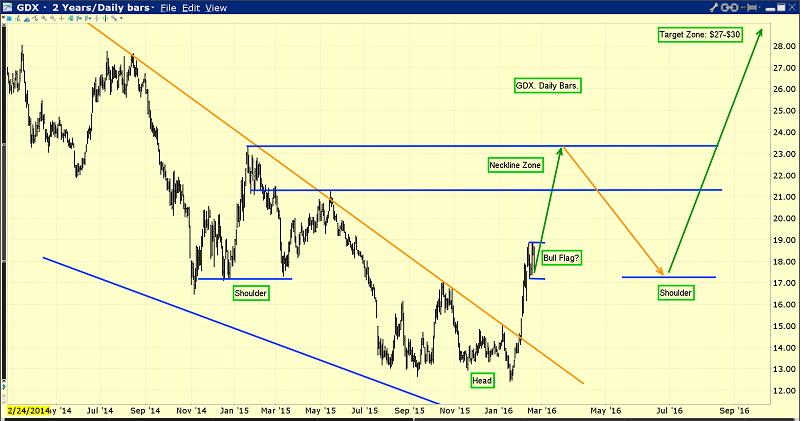
Take a look at this spectacular Market Vectors Gold Miners (N:GDX) daily chart. I’m predicting that the inverse head and shoulders pattern that is forming now will probably come to be viewed as one of the greatest chart patterns of all time.
The $200 gold price rally has been a “game changer” for the bottom line profits of many gold and silver mining companies. There are a myriad of junior stocks that have rallied 100%, 200%, and more, just since December.
From an Elliot Wave Theory (EWT) perspective, gold, silver, and related stocks may now be rallying in a “C wave”. Of all the Elliot waves, the C wave moves the price by the largest amount, in the shortest amount of time.
The C wave is like a siren on the rocks for investors who are not invested, but want in. It tends to “goad” investors into expecting a correction, when rally intensification is the theme in play. When a C wave process begins to unfold, shorting needs to be held to a “bare bones minimum”, particularly when the market in play is gold.
The bottom line for gold stocks is this: GDX may pause in the $21 area, but investors should not be booking anything other than very light profits, until my $27 - $30 target zone is acquired!
Written between 4am-7am. 5-6 issues per week. Emailed at aprox 9am daily.
Stewart Thomson is a retired Merrill Lynch broker. Stewart writes the Graceland Updates daily between 4am-7am. They are sent out around 8am-9am. The newsletter is attractively priced and the format is a unique numbered point form. Giving clarity of each point and saving valuable reading time.
Risks, Disclaimers, Legal
Stewart Thomson is no longer an investment advisor. The information provided by Stewart and Graceland Updates is for general information purposes only. Before taking any action on any investment, it is imperative that you consult with multiple properly licensed, experienced and qualified investment advisors and get numerous opinions before taking any action. Your minimum risk on any investment in the world is: 100% loss of all your money. You may be taking or preparing to take leveraged positions in investments and not know it, exposing yourself to unlimited risks. This is highly concerning if you are an investor in any derivatives products. There is an approx $700 trillion OTC Derivatives Iceberg with a tiny portion written off officially. The bottom line:
Are You Prepared?
Which stock should you buy in your very next trade?
With valuations skyrocketing in 2024, many investors are uneasy putting more money into stocks. Unsure where to invest next? Get access to our proven portfolios and discover high-potential opportunities.
In 2024 alone, ProPicks AI identified 2 stocks that surged over 150%, 4 additional stocks that leaped over 30%, and 3 more that climbed over 25%. That's an impressive track record.
With portfolios tailored for Dow stocks, S&P stocks, Tech stocks, and Mid Cap stocks, you can explore various wealth-building strategies.
