Gold and gold stocks posted significant gains over the last weeks. The yellow metal has broken out of the falling wedge (shown on the monthly chart below) - a strong buy signal, making gold bulls overexcited.
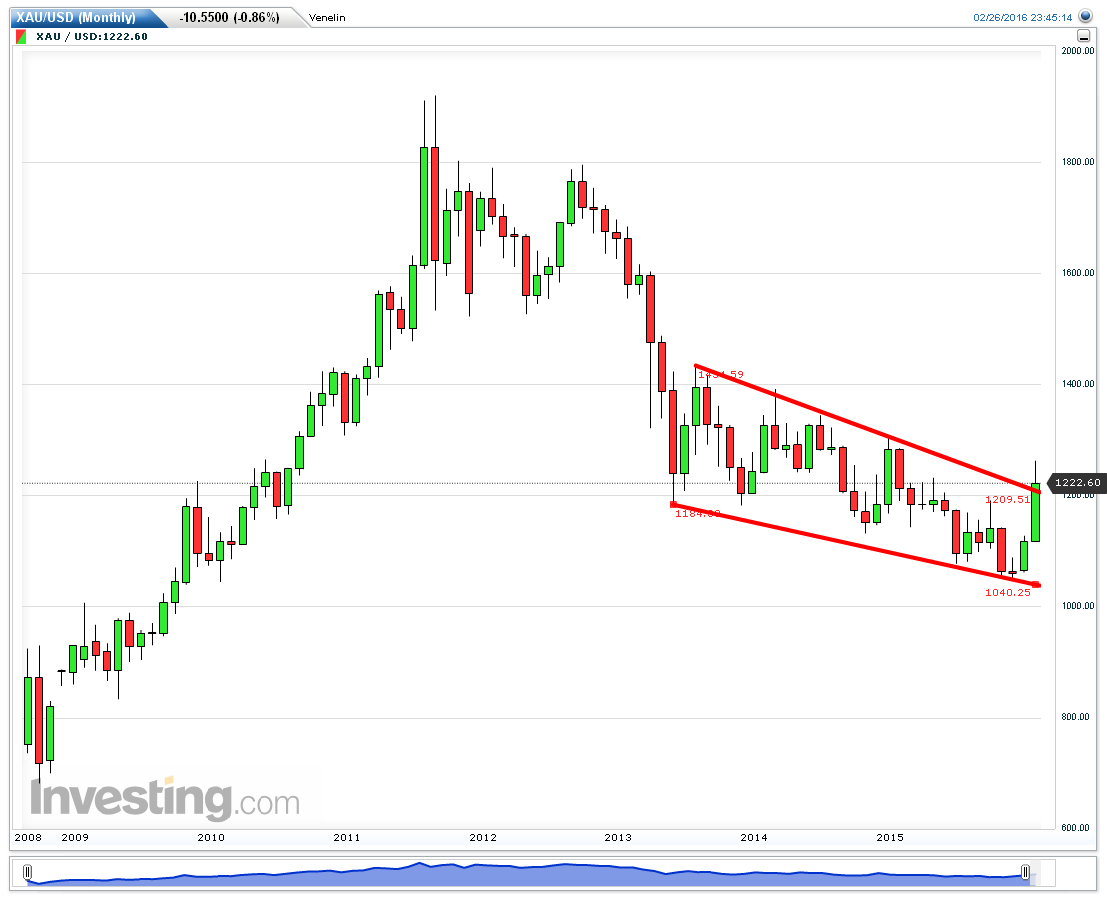
Has the shiny metal finally bottomed? If this is the case, the recent gains by the precious metal should be confirmed by the price action on the gold-related markets. Their analysis could provide additional clues about the further direction of the yellow metal.
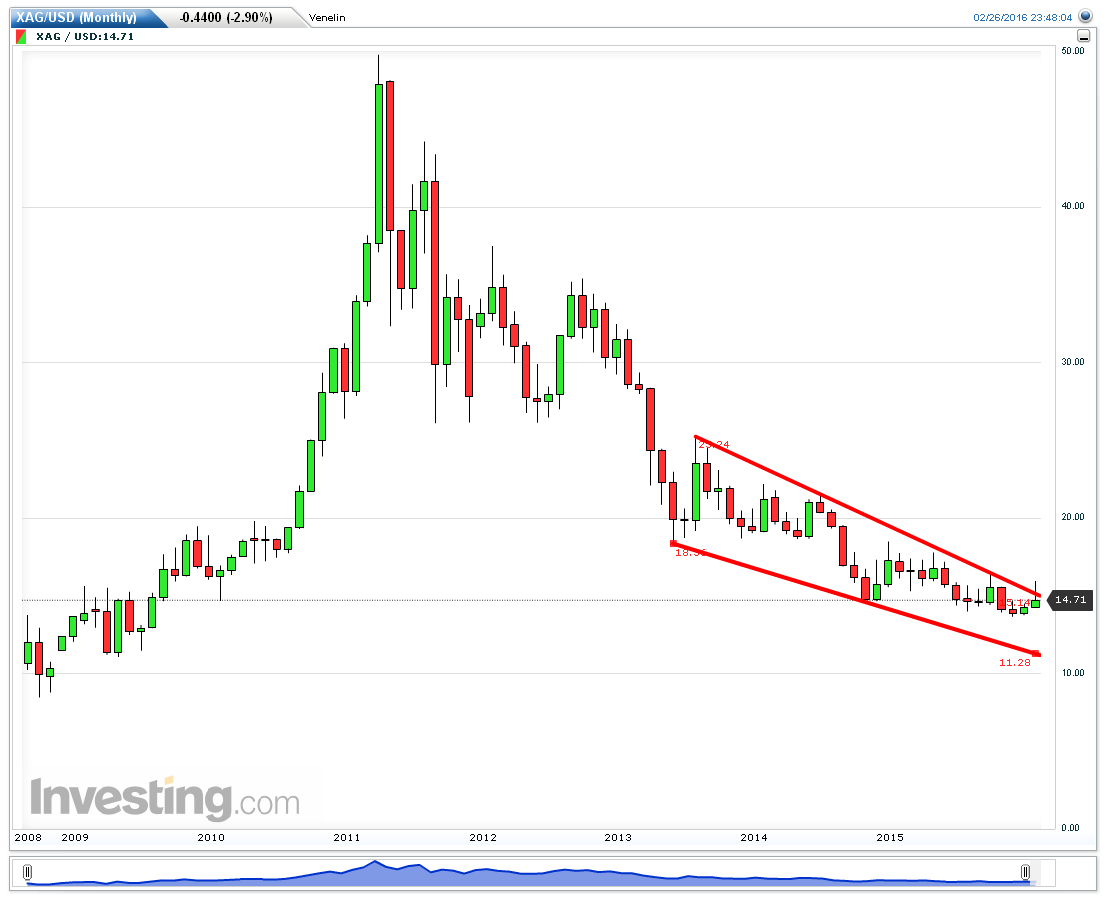
Silver is related to gold, both metals move in tandem, gold leads, the white metal follows. On the silver monthly chart below we can see the price piercing the upper boundary of the wedge, pulling back and resuming its movement within the range of the wedge, i.e., silver isn't tracking closely the upward movement by gold for now.
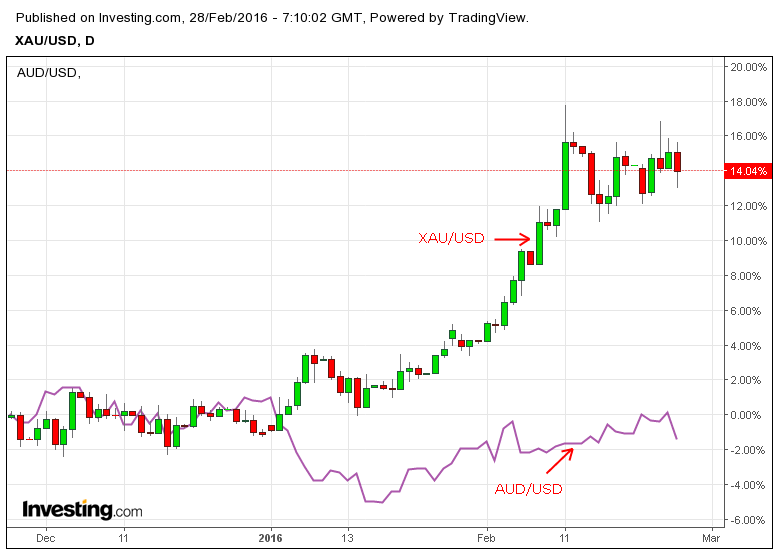
Another market correlated to the shiny metal is the AUD/USD pair. Due to the fact that Australia is one of the biggest producers and exporters of gold in the world, gold prices have an impact on AUD/USD. Generally, when the price of the yellow metal rises, the Aussie appreciates as well, with gold playing the leading role. A comparison between both charts (represented on the daily chart below) shows the shiny metal outperforming the Australian dollar since the beginning of its rise in December 2015. Actually, there still isn't any reaction by the aussie to the gold rally.
The gold price is related to the US dollar as well, in general, there is an inverse relationship between them, when the greenback rises, the price of the yellow metal moves lower. Switching to the US dollar index monthly chart below, one could receive the impression that there is already a double top in play, but what looks like a double top could easily turn into some other formation - an A-B-C correction, an ascending triangle, an ascending wedge, a rectangle, or some other, more complicated and longer lasting corrective set-up.
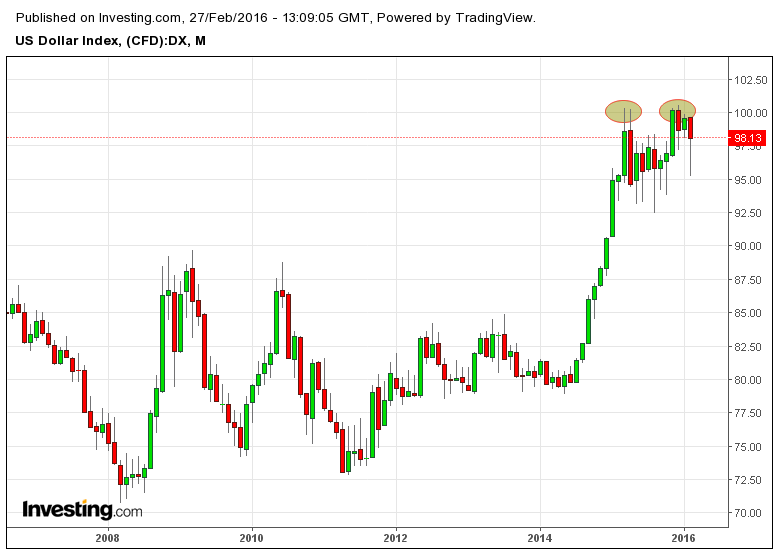
Unfortunately the US dollar index chart can't give us any clue abouth the further direction of the greenback. For more guidance we should analyze similar markets.
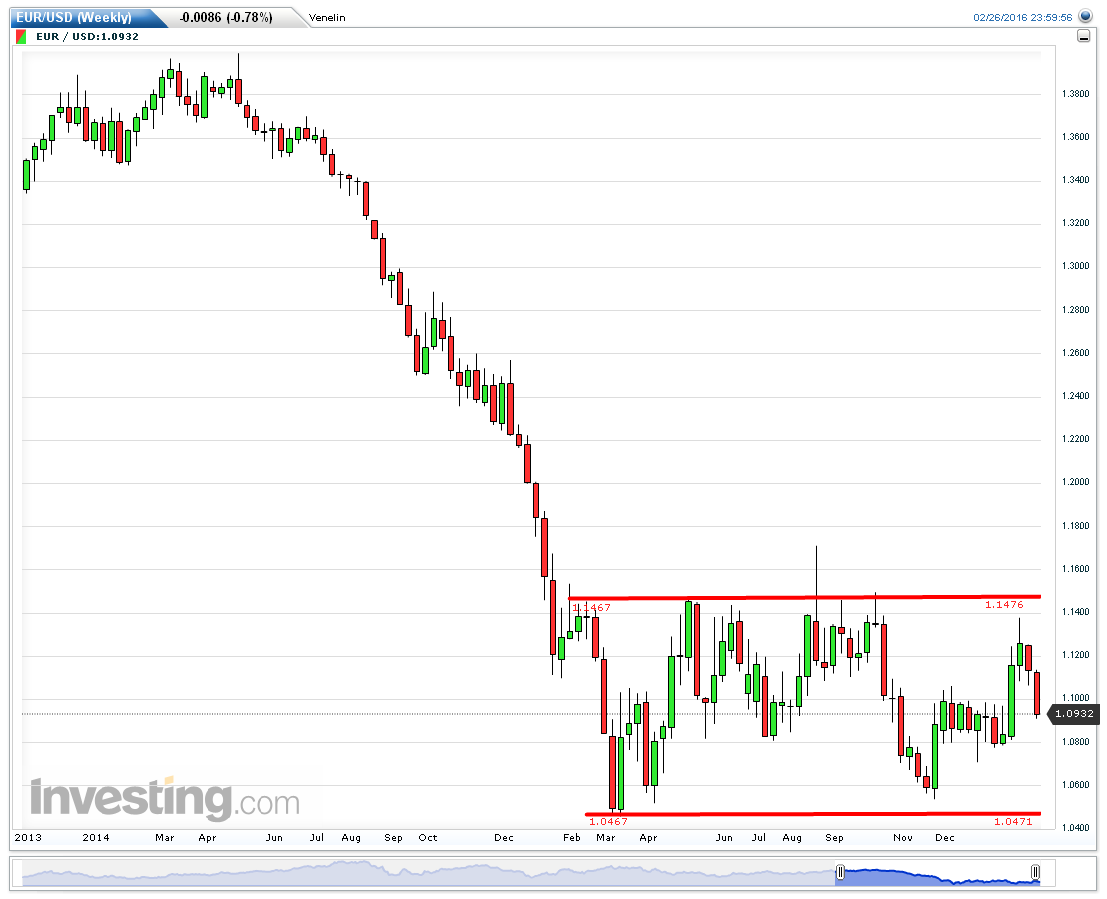
As the EUR/USD weekly chart below illustrates, the currency pair has been trapped within a trading range since March 2015. The break out of the falling wedge by gold wasn't accompanied by a break of the upper channel's boundary by the couple approaching it, the price pulled sharply back, forming wide spread down candles. As long as the pair trades sideways within the rectangle it could target the floor again or even break through it, dragging down the price of gold (in case the negative correlation between both markets remains intact).
The USD/CHF monthly chart below is showing even a bullish bias for the US dollar.
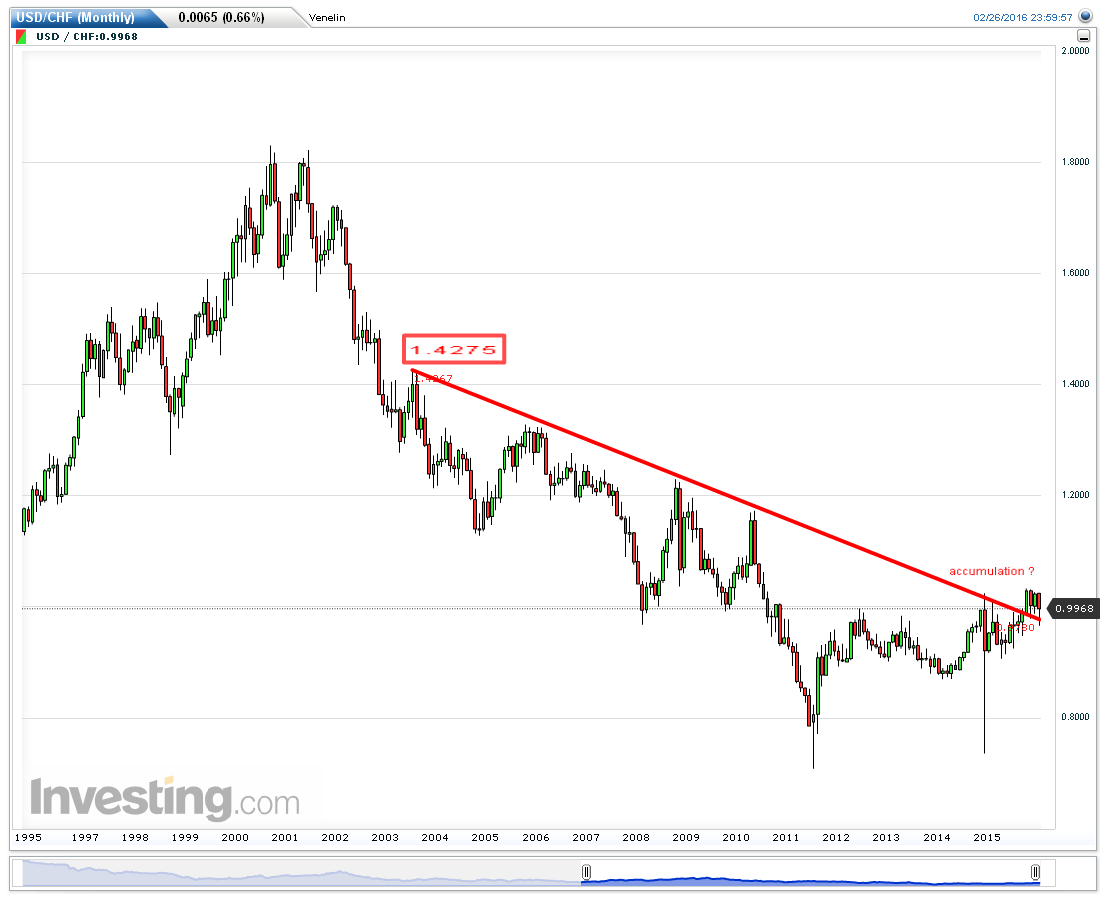
The down-sloped trend line drawn on the chart comes a long way back from the 1.4275 high, marked in August 2003. Each time the price touched it, it pulled back, forming a wide spread down candle, until October 2015, when the pair successfully broke through this tough resistance, testing it now as a support - a strong bullish signal for the greenback, while bearish in general for gold.
On the other hand, it wouldn't be unusual for gold and the greenback to rise simultaneously, especially in times of uncertainty and geopolitical instability. Correlations shift, for some period they can turn positive from negative and vice versa.
Will silver and the aussie follow the gold rally with a delay or is the recent rise by gold a bull trap? I still don't know the answer to this question, but what I do know is that the upward move by the precious metal is still not confirmed by the price action on the gold-related markets, what makes me neutral for now.
