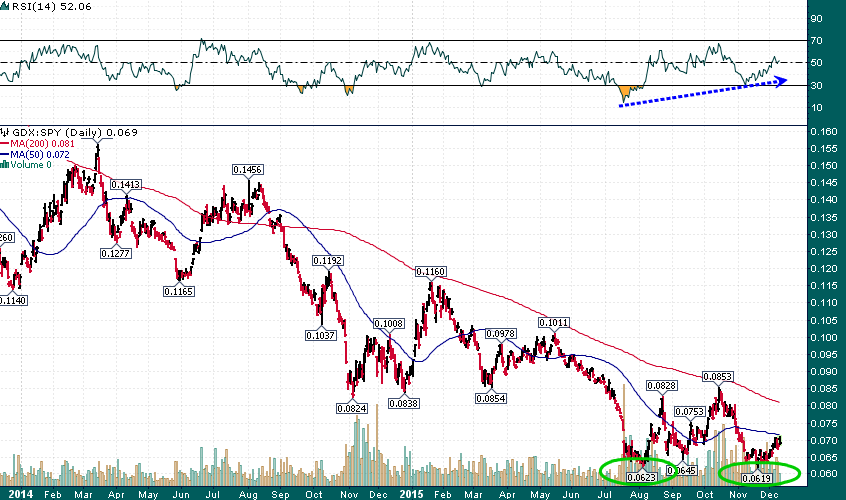
While the gold miners (N:GDX) continue to experience significant day-to-day volatility the ratio chart of GDX relative to the S&P 500 (N:SPY) shows a clean double-bottom pattern with a notable bullish momentum divergence:

The October/November decline in the miners made a marginal new low in the GDX//SPY ratio, however, the relative strength index (RSI-14) did not even fall below 30 at this new low in price.
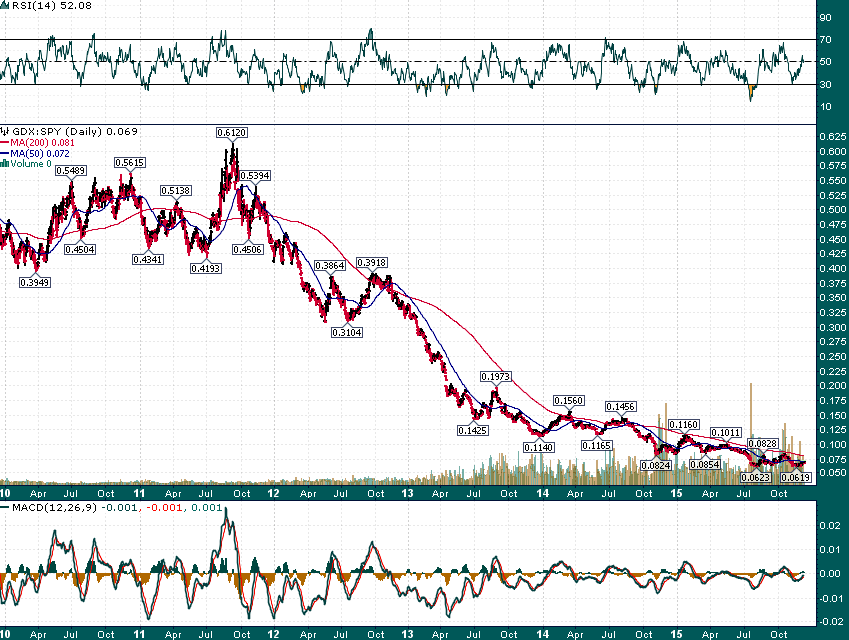
This is a significant development considering that the gold miners have been in 4+ year bear market and the S&P 500 is enjoying a 6 1/2-year bull run. Moreover, this year’s trading volumes are extraordinarily high (record volumes for GDX), which is characteristic of a bottoming process:
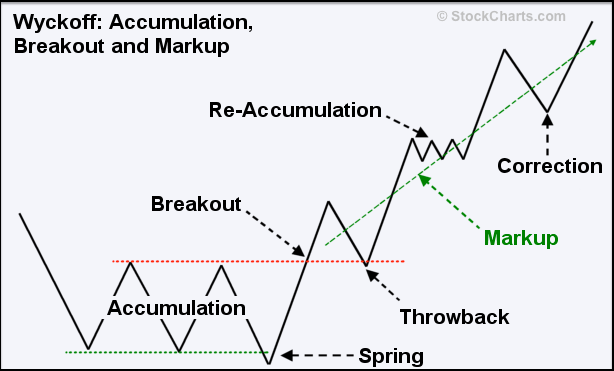
If we are in the ‘accumulation’ phase of the bottoming process it will take a break-out above major support/resistance near .085 in the GDX/SPY ratio to confirm that a long-term bottom has indeed been put in place in this ratio:
The best part about watching this ratio and/or putting on a long GDX/short SPY pairs trade is that we have a clear reference price level that can let us know when we’re wrong (the double-bottom level ~.062).
Via Energy and Gold.com

