WEEKLY REVIEW
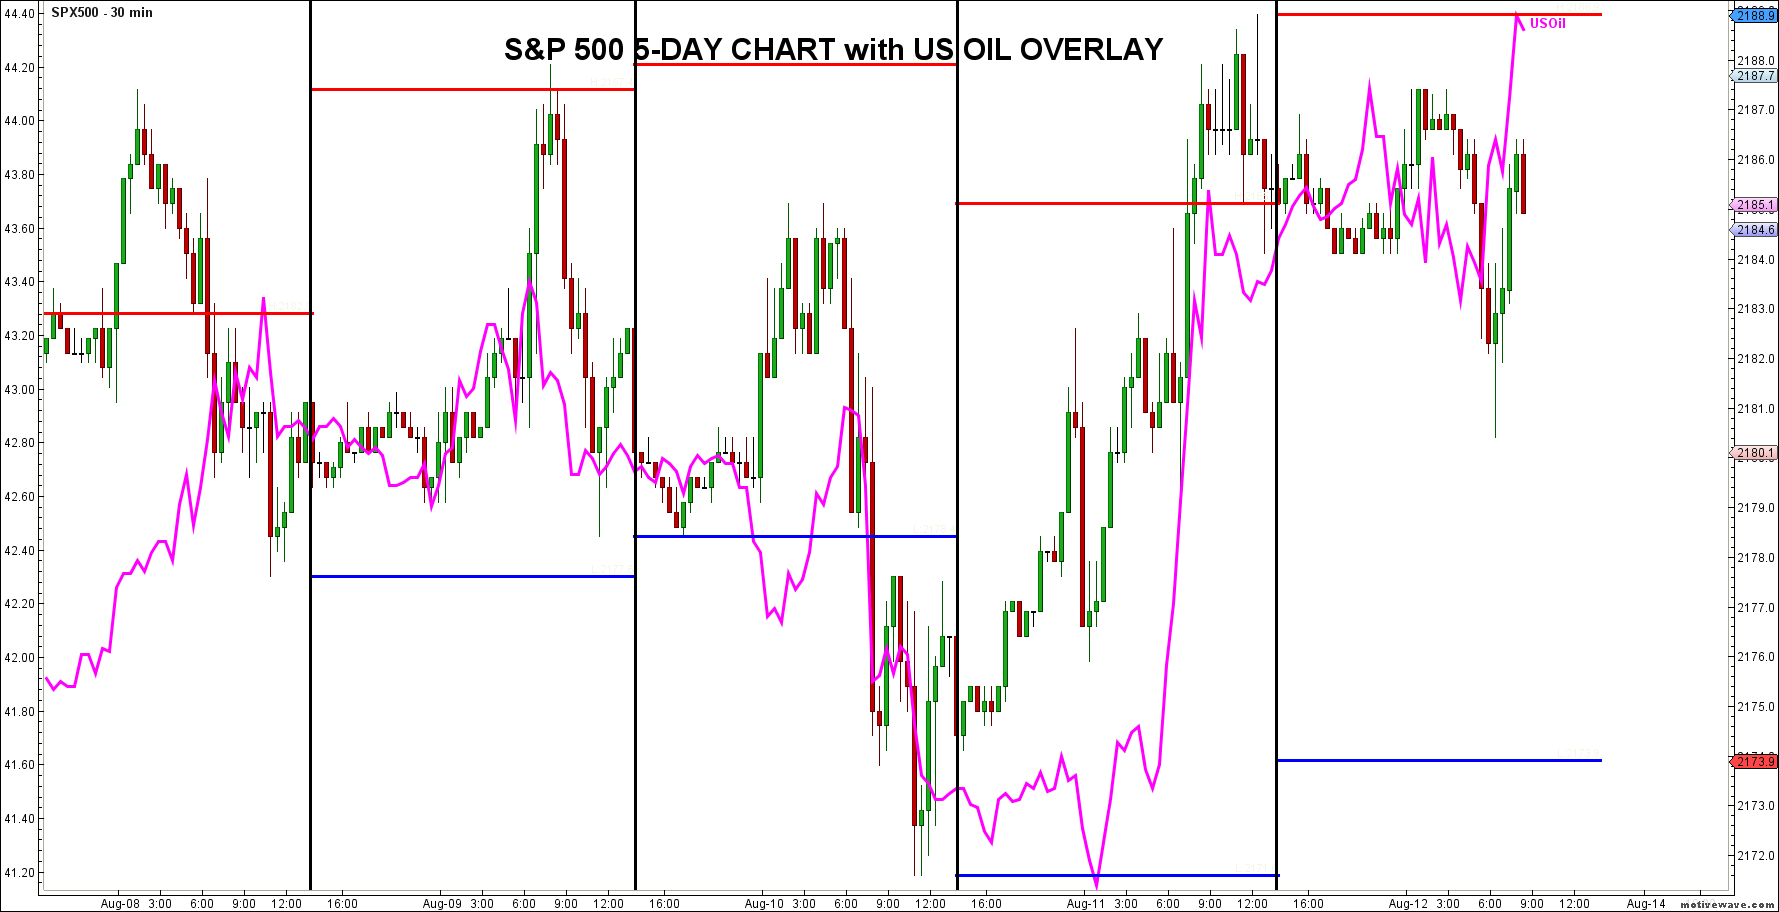
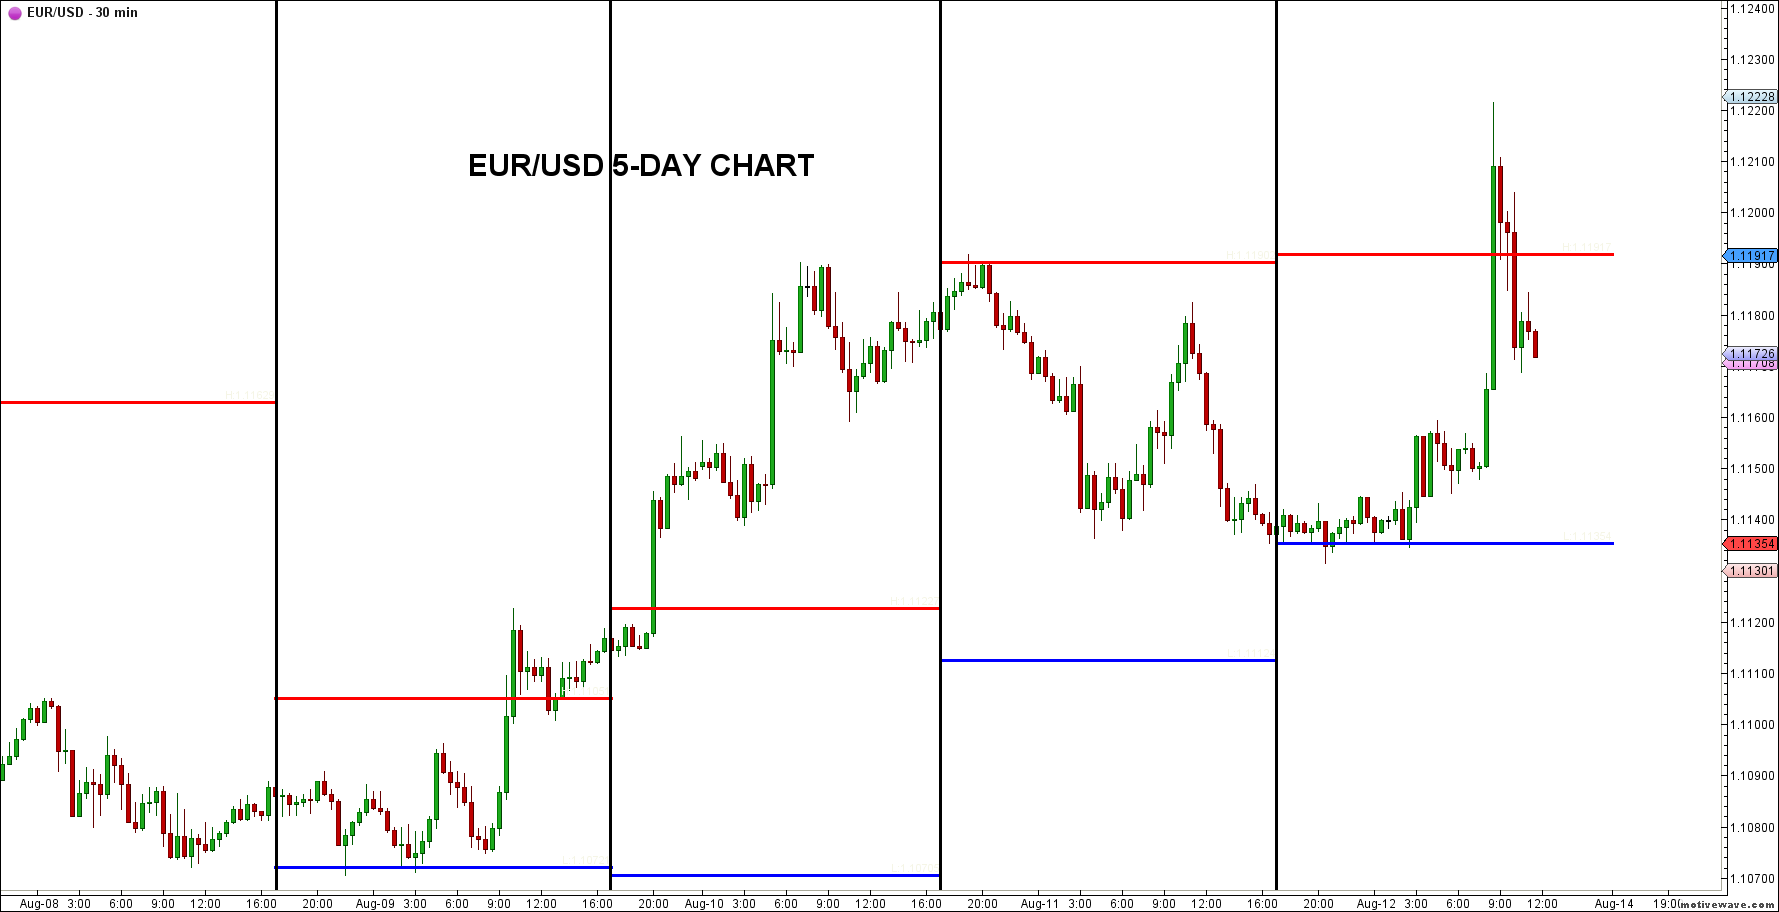
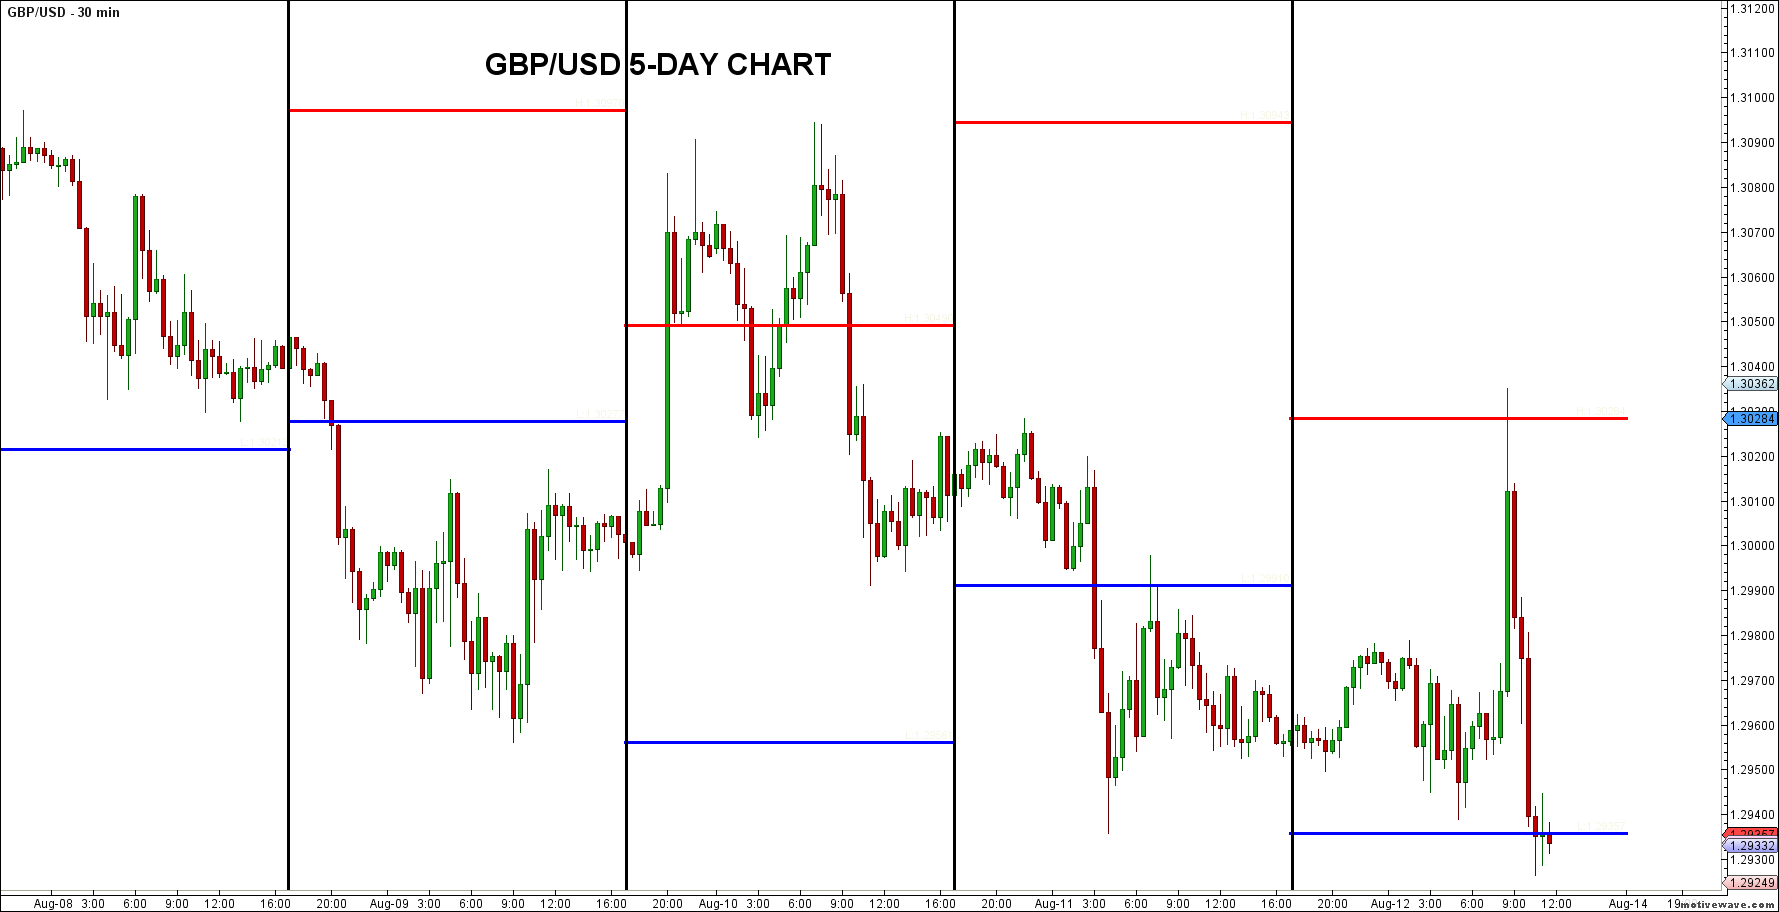
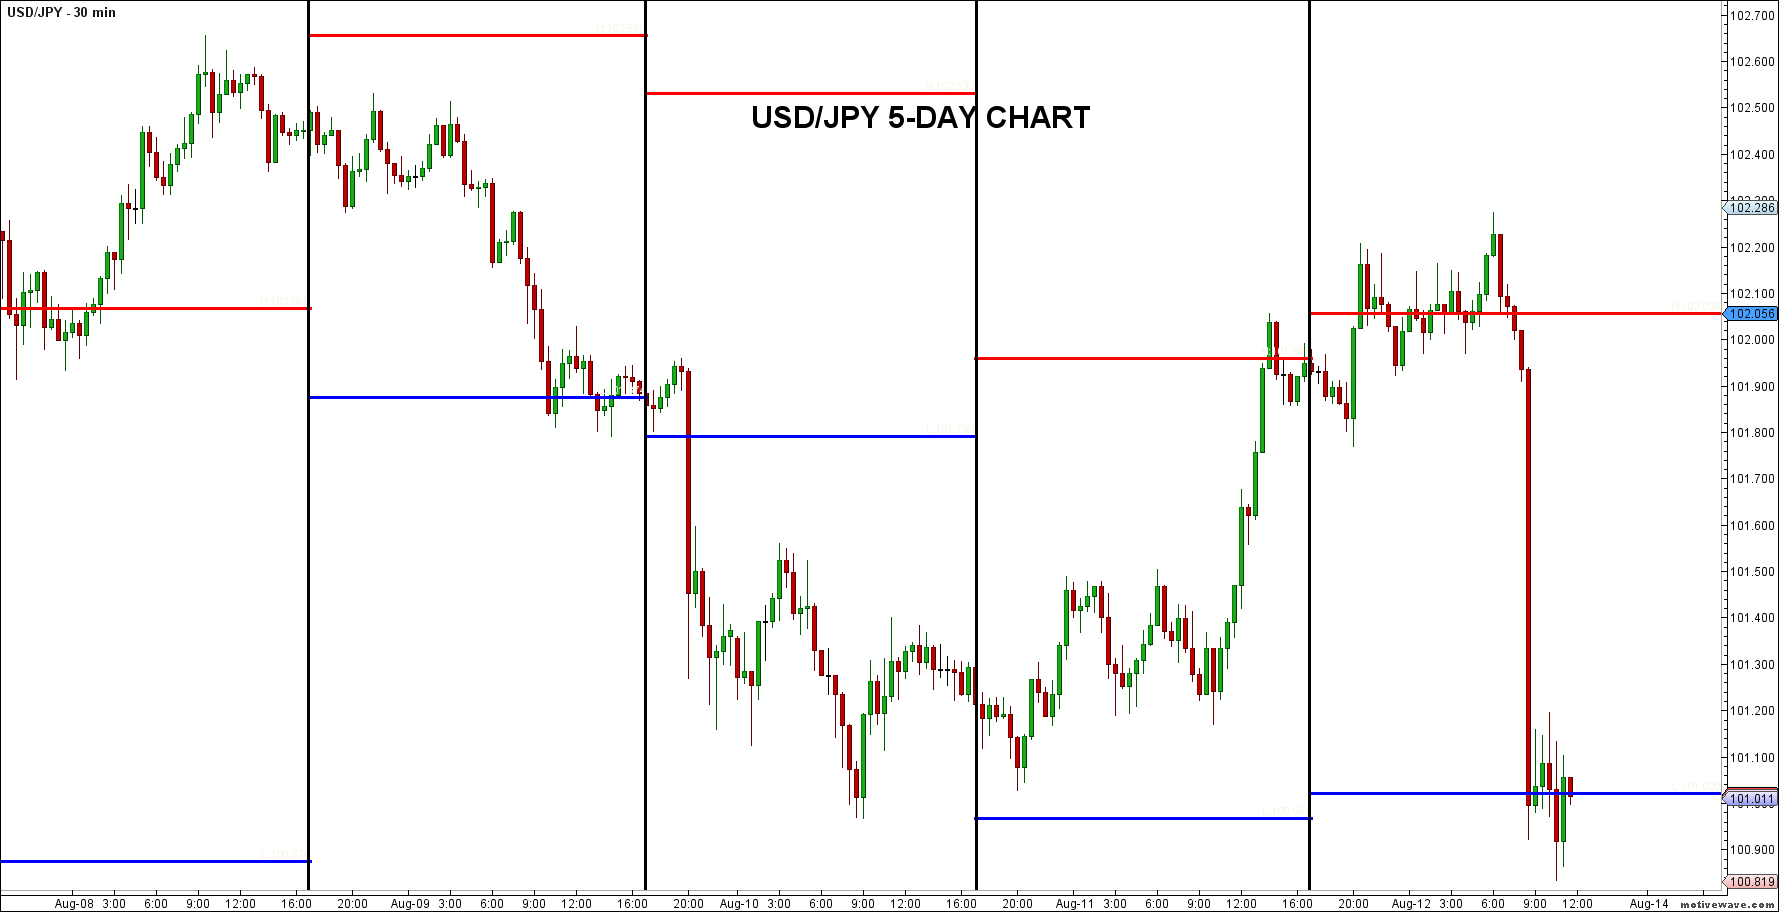
It was a fairly quiet week in the financial markets as economic data was limited, and major central bank meetings were non-existent. Nonetheless, equities were choppy closing lower by almost 2 points to 2,182.90. Oil got a nice bounce and managed to stay above the $40 threshold for the second straight week to close at $43.93. The British Pound traded lower following last week’s BoE’s monetary policy decision to close at a four-week low at $1.2975. Meanwhile, demand for safe haven assets increased as gold closed the week up almost $20/ounce, and the US Dollar weakened with EUR/USD jumping 1% for the week. The yen also strengthened with USD/JPY falling by 1.31% this week, and 10-Year Treasury yields dropping 11 basis points to 1.48%

US ECONOMY
Retail sales for the month of July came in flat versus expectations for a 0.4% increase. This may signify that consumer spending may be taking a breather, resulting in a slower acceleration in economic growth for the third quarter. With that said, the markets were mainly in rebalancing mode this week as investors used last Friday’s non-farm payrolls number to gauge the strength of the US economy. Although the data beat expectations, majority still seem to be leery with regards to the Fed’s trajectory of interest rates. Given the rally in US Treasuries and the selloff in the US dollar, the markets are still expecting a very gradual process to hike rates going forward. Fed funds futures have declined slightly to a 41.6% probability of a 25bp rate hike by the end of 2016, compared to 42.7% at last week’s close. EUR/USD shot upto 1.1196 from Monday’s open at 1.1085.
EUROPEAN ECONOMY
Eurozone GDP for the second quarter was in line with expectations growing by 0.3%. Growth in the Eurozone is expected to remain low due to uncertainties caused from Brexit that will weigh on exports. Moreover, given the economic implications of Brexit, the Bank of England last week decided to loosen monetary policy by slashing rates and increasing the bond purchasing program. The operation started off on the wrong foot as large institutions rejected offers to sell gilts to the BoE. The central bank did however note that the £52m shortfall would be purchased later during the second half of its program. Meanwhile, sentiment continues to be sluggish as a recent survey showed that UK businesses are expecting lower investment and job openings as a result of Brexit.
ASIAN ECONOMY
The Japanese yen strengthened slightly for the week after weakening last Friday as a result of a stronger-than-expected jobs number. Investors weighed in onthe labour market data, and the rally in US treasuries suggest that the market continues to favor a gradual tightening of monetary policy. USD/JPY sold off sharply from its highs of 102.66 on Monday morning to reach a low of 100.92, before closing the week at 101.09.
China on the other hand continues to face massive headwinds as both exports and imports in July fell more than projected by economists in July. Due to the sluggish growth prospects following Brexit in the external environment, the Chinese government is now utilizing fiscal policy to boost domestic investment and consumption.
Elsewhere, the Reserve Bank of India left rates unchanged as the nation’s food prices is adding pressure to push inflation above their 5% target. Alternatively, the Reserve Bank of New Zealand cut rates to a record low of 2% to fight low inflation. NZD/USD has sold off from its weekly highs of 0.7341 to close the week at 0.7240.
OIL
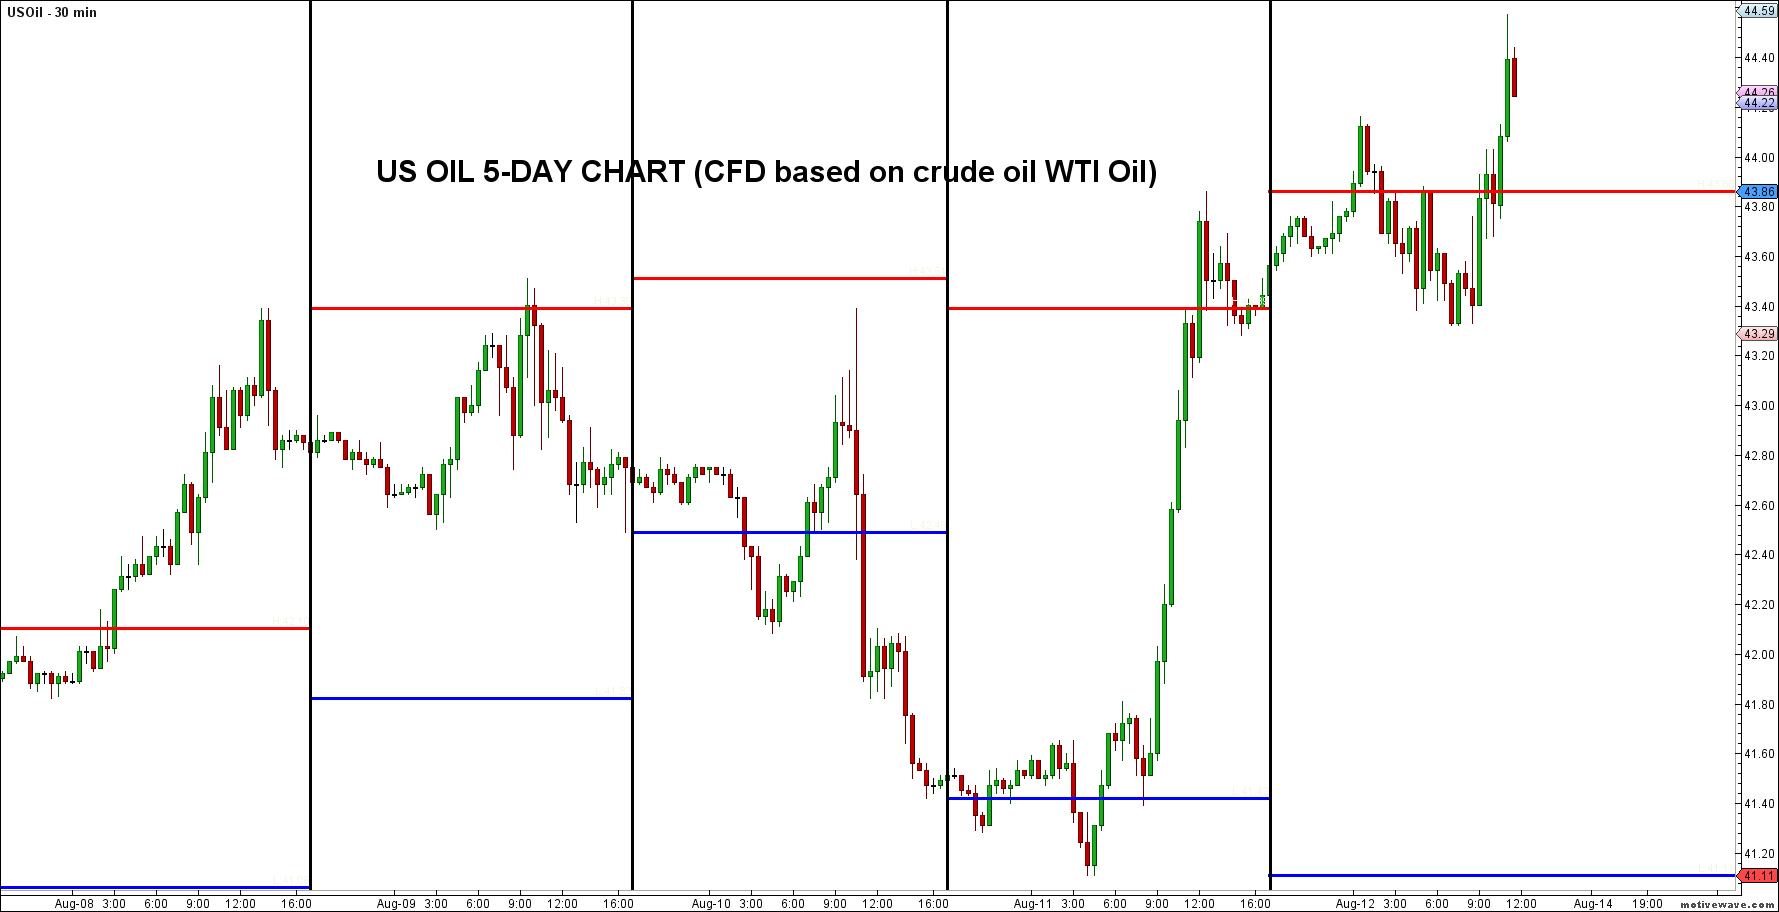
Oil traded in a choppy range once again, but managed to close $1.36 higher fromMonday’s close. Prices seemed to have gained some momentum in August following its 14% decline in July. The EIA on Wednesday reported that US oil stockpiles gained 1.1 million barrels the prior week compared to expectations for a 1 million-barrel decline. Furthermore, downside risks increased following reports that Saudi Arabia had told OPEC that the nation’s output climbed to a record high of 10.67 million bpd in July. Crude traded at a high of $43.39 prior to the data release, and sold off to reach a weekly low of $41.11/barrel following the announcement. Prices thereafter bounced to close the week at $43.93.
The S&P 500 also traded in a range similar to oil, as the index continues to move lockstep with crude prices. For the week, the S&P 500 rose 2 points to close at a record high of 2,182.69. Prices managed to bounce off from its lows of 2,171.60 on Wednesday simultaneously with oil. Despite the record close, equity trading volumes for the week were almost a third lower than the 30-day average.
