Many traders, myself included, thought that the lackluster economic calendar early this week could mark the onset of the summer doldrums, but Tuesday’s big move in EUR/USD has certainly kept us on the edge of our seats.
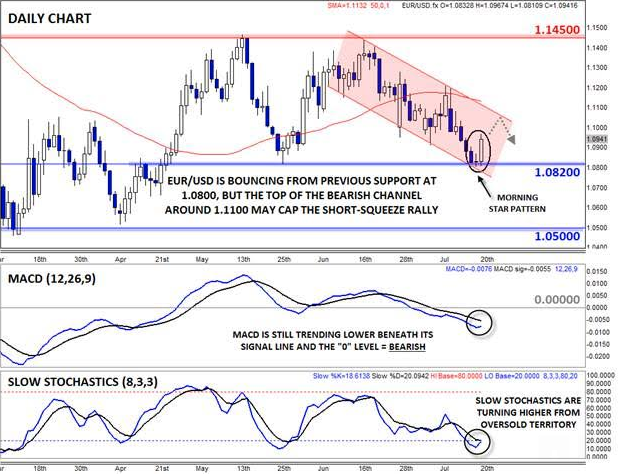
After briefly tagging a nearly 3-month low under the 1.0820 level Monday, the world’s most widely-traded currency pair has risen like a phoenix from the ashes Tuesday. As of writing, the pair is trading all the way up at 1.0950 and intraday bulls may be turning their eyes toward the 1.10 level next. Perhaps most surprisingly, this move has occurred despite a lack of specific economic news on either side of the Atlantic; instead, the big rally has been fueled by a combination of profit-taking after the recent drop and an outsized short squeeze off the support level.
Last Wednesday’s nearly concurrent press conferences from the heads of the Federal Reserve and European Central Bank confirmed the growing monetary policy divergence between the two regions: Fed Chair Janet Yellen implied she would like to start raising rates sooner rather than later in order to ensure a gradual pace of increases, while ECB President Mario Draghi left the door open to expanding the ECB’s quantitative easing program further and, at minimum, allowing it continue for its full term until September 2016.
Technical View: EUR/USD
From a technical perspective, Tuesday’s’s rally will complete the clear Morning Star* candlestick pattern on the daily chart. This relatively rare three-candle pattern shows a shift from selling to buying pressure and often marks a near-term bottom in the market. That said, the pair is still within its near-term bearish channel and the MACD is still signaling bearish momentum by trending lower below both its signal line and the “0” level. So it’s unlikely that the pair has formed a major bottom. Indeed, the oversold reading in the Slow Stochastics suggests that bearish sentiment had just reached a near-term extreme and that the recent downtrend could soon resume.
For now, traders will look at the top of the bearish channel and the 50-day MA around 1.1100 as resistance and could look to re-establish short trades if and when that area is reached. Meanwhile, a break below previous support in the 1.0800-20 zone could open the door for another leg down toward 1.0700 or even the 12-year low near 1.0500 in time.
* A Morning Star candle formation is relatively rare candlestick formation created by a long bearish candle, followed a small-bodied candle near the low of the first candle, and completed by a long-bodied bullish candle. It represents a transition from selling to buying pressure and foreshadows more strength to come.

Source: FOREX.com
