S&P 500 Monthly-Chart Perspective
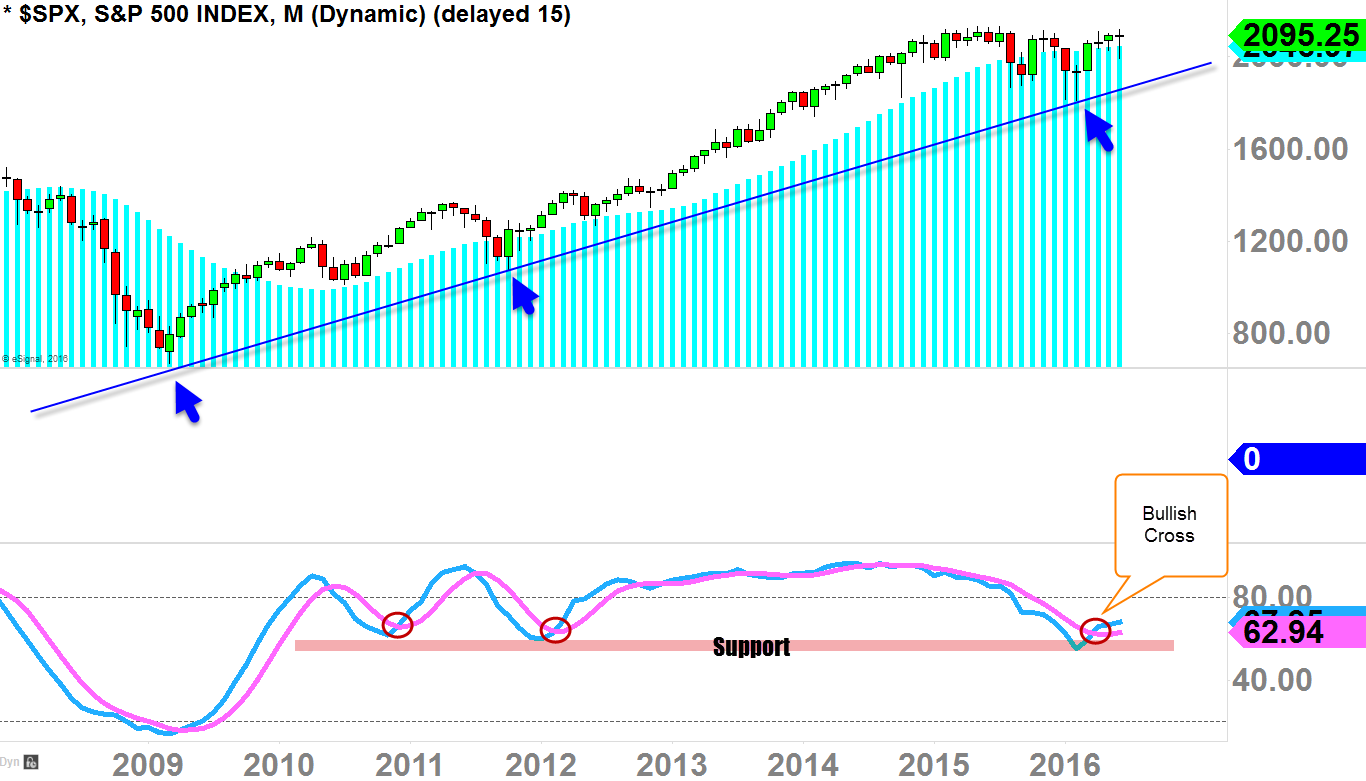
By the closing-bell last Monday, you would find the monthly-chart candle looking pretty bleak with the red-bearish-colored candle ready to dive below the monthly 20-SMA (blue histogram in the chart below).
But the extraordinary thing has happened last three days as it saves the whole month of June's sentiment, as the monthly-candle so quickly transformed by the close today with doji candle trading above the monthly-20SMA as we close the month of June's final day of trading.
Why is it so important?
Because by the closing-bell last Monday, the oscillator (in the chart below) was actually curling back down not able to see any openings between the two lines (signaling abrupt bearish pressure).
Long-term buyers/bulls want to make sure this oscillator continues to see it's opening and widening to the upside for the continuation of the primary-term uptrend as we are still staying on that Oscillator-support (bullish sentiment).
- Bulls emergency search for finding beauty has ended today with positive result ending the month of June with bullish sentiment.
 Weekly-Chart Perspective
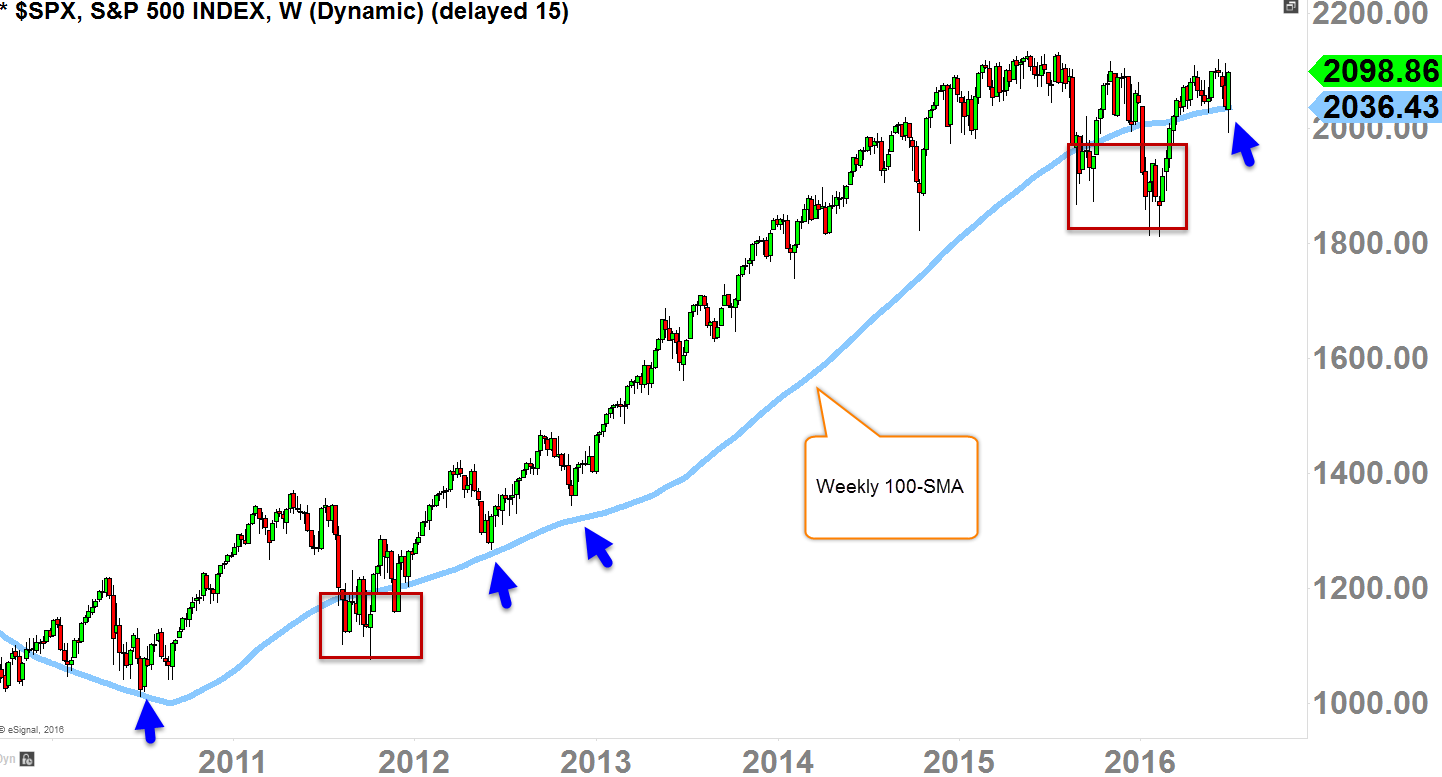
When you diagnose health of the primary-term uptrend, you want to see weekly-chart staying above the 100-SMA (simple moving average), because the sentiment is bullish as long as we stay above this moving average on the weekly-chart.
As you can see in the chart below, we have been below this moving average sending "shocking waves" throughout the market (red boxes); but as it bounces back above this moving average, buyers regain confidence.
Last three days, bulls has found beauty because without the last three days move, the weekly-candle would be red and sitting below this moving average today.
This means the bullish sentiment continues as this was VERY FAST recovery.

Which stock should you buy in your very next trade?
With valuations skyrocketing in 2024, many investors are uneasy putting more money into stocks. Unsure where to invest next? Get access to our proven portfolios and discover high-potential opportunities.
In 2024 alone, ProPicks AI identified 2 stocks that surged over 150%, 4 additional stocks that leaped over 30%, and 3 more that climbed over 25%. That's an impressive track record.
With portfolios tailored for Dow stocks, S&P stocks, Tech stocks, and Mid Cap stocks, you can explore various wealth-building strategies.
