
Last week I reviewed Apple, Microsoft and Amazon using Elliott Wave Theory (EWT).
See my articles here:
– Apple
– Microsoft
– Amazon
Of the seven most important stocks of the current market (Facebook (NASDAQ:FB), Apple (NASDAQ:AAPL), Netflix (NASDAQ:NFLX), Alphabet (NASDAQ:GOOGL), Microsoft (NASDAQ:MSFT), Amazon.com (NASDAQ:AMZN) and NVIDIA (NASDAQ:NVDA)), the next to review is Alphabet as it has the 4 th largest market cap: $945 billion. The first under $1 trillion.
The daily chart in Figure 1 below shows the EWT count since the February high: Blue Primary Wave-III. The March crash subdivided in three clear waves: black a, b, c, and wave-c was almost exactly 1.618x a. Picture-perfect. Who said EWT and Fibonacci do not work?
Figure 1
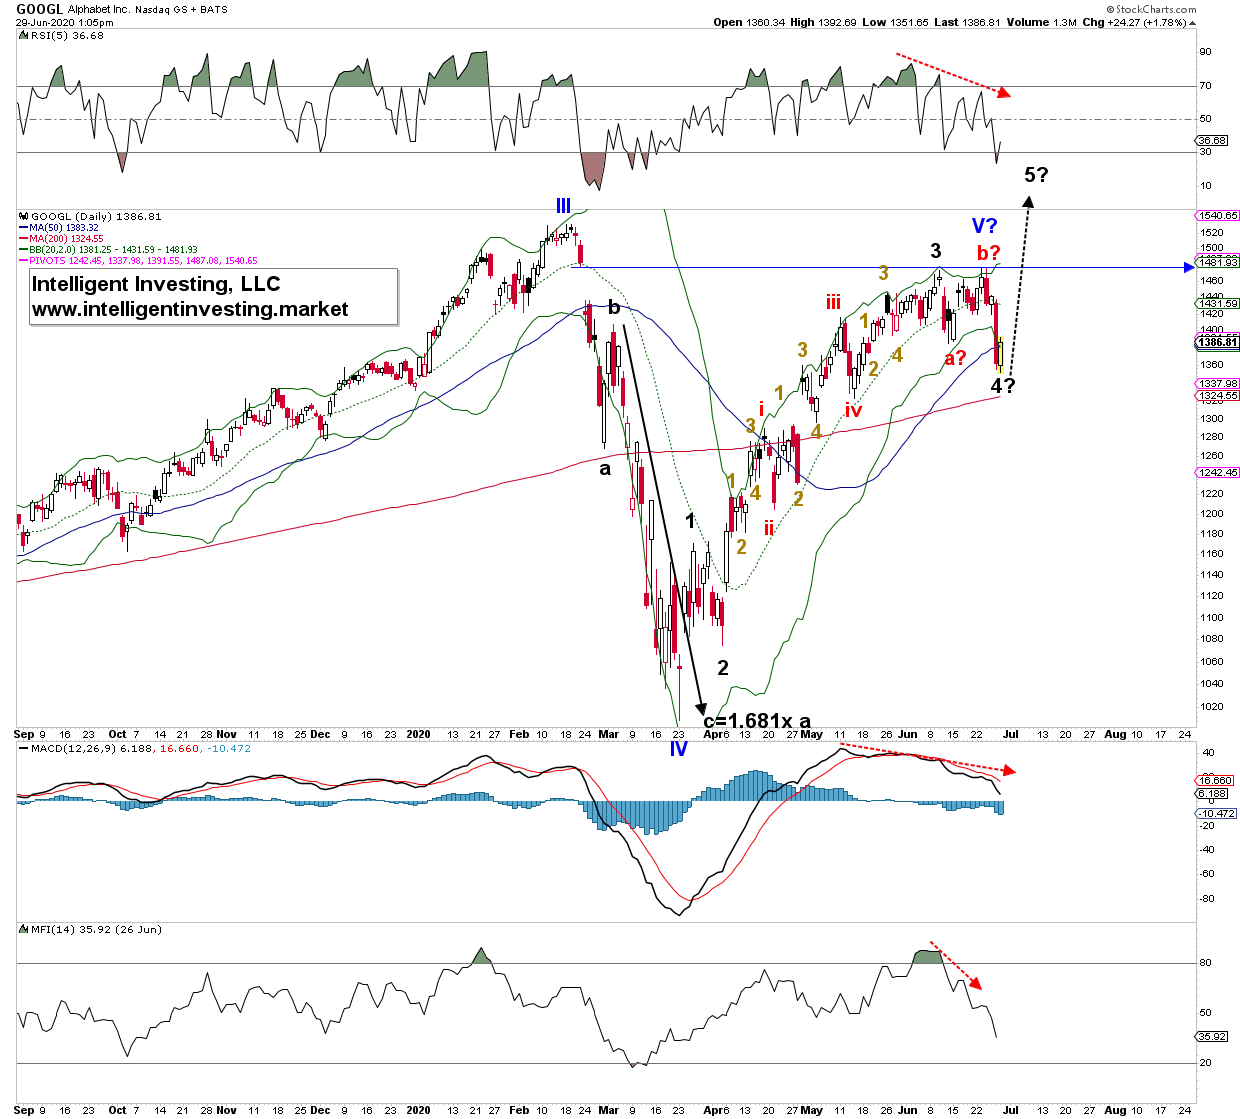
Since the infamous March 23 low, which I have labelled as primary Wave-IV, I can count five waves up may have completed (blue V?), but Alphabet could decide to add one more wave-5 to its tally. Today's low was then wave-4 of a possible – in EWT terms – expanded flat ( wave c>b=a). Wave-5 can then target as high as around $1,565 for a classic 5=1 relationship, but 5th waves can also stall at the 0.618x extension, which in this case would target $1,485-ish. TBD.
For now, we must content with a picture-perfect gap fill last week (blue horizontal arrow) on a significant negative divergence of the technical indicators.
Besides, all the technical indicators are still on a sell signal.
Where does that leave Alphabet in the bigger picture?
Figure 2 below shows the monthly timeframe chart with my preferred EWT count.
Figure 2
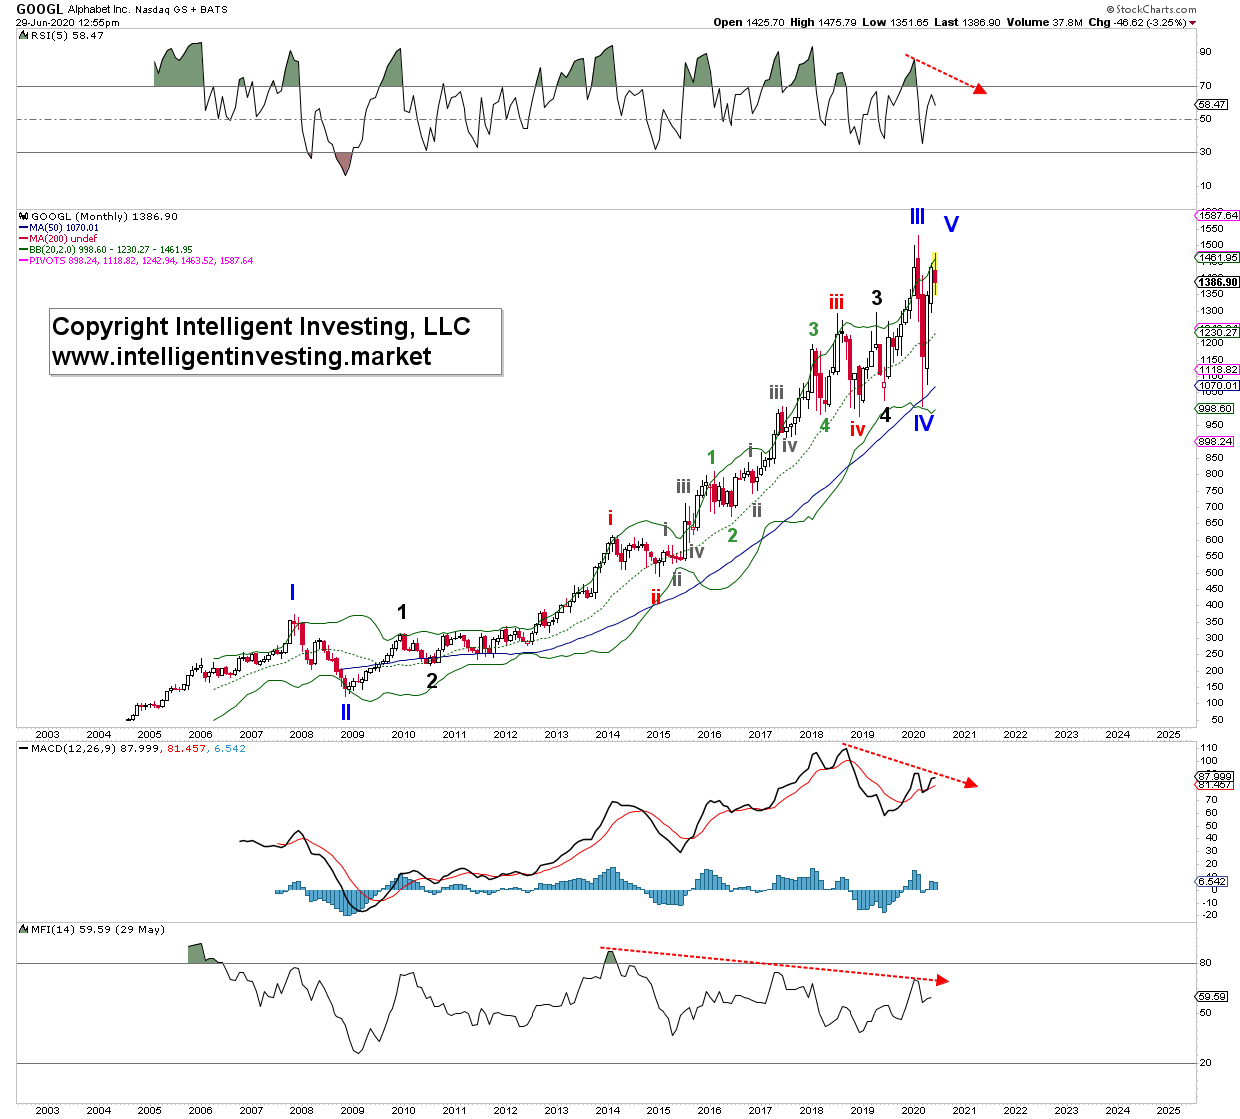
Unlike the three tech stocks reviewed prior (Apple, Amazon and Microsoft), Alphabet didn't start trading until mid-2004. But like all stocks, it also took a hit during the 2007-2009 market crash. I have labelled that high and low as (blue) Primary I, II. Since the price low made in 2009, Alphabet has been on a tear, up until early 2018. It then went mostly sideways for many months ($1200->$975->$1275->$975->$1300->$1025) before launching to the February 2020 all-time high (ATH). That launch was technically a fake breakout, as price swiftly returned to the scene of the crime: $1,000. I have shown this pattern for Apple, Microsoft and Amazon: big run-up, sideways for many months, breakout.
If my EWT count is correct, then the March low was primary-IV, and Alphabet is now completing Primary-V of a large Cylce-1 wave. Two comes after one, so a Cycle-2 should be expected to ideally $400-600(!).
Note, as was observed for the other three stocks, the negative divergence on the monthly technical indicators: less momentum, less money flowing into the stock while price is moving higher. Although divergence is only divergence until it is not, it must be noted. It is often a forewarning of worse things to come. Just like the divergences on the daily chart forewarned of last week's sell-off. If divergences on the daily chart can foretell of an 8.5% drop in price, imagine what such divergences on the monthly chart can do.
For now, the bulls' short-term hope (days) is for the last wave-5 to around $1,485-1,565 before the next more significant correction kicks in. The bulls' long-term dream (months) is that this correction is not a Cycle-2 wave causing a 50-60% haircut but only a major-2 wave. Major-2 will then ideally stall around $1,230 +/- 30 before wave-3 to new ATHs kicks in. TBD.
For now, know your timeframe for trading and investing, and it would not hurt to re-assess the potential upside reward versus downside risk. Nobody got poor from being careful, cautious and conservative in the markets. Or, as Warren Buffet once said, "I got rich because I always sell too early."