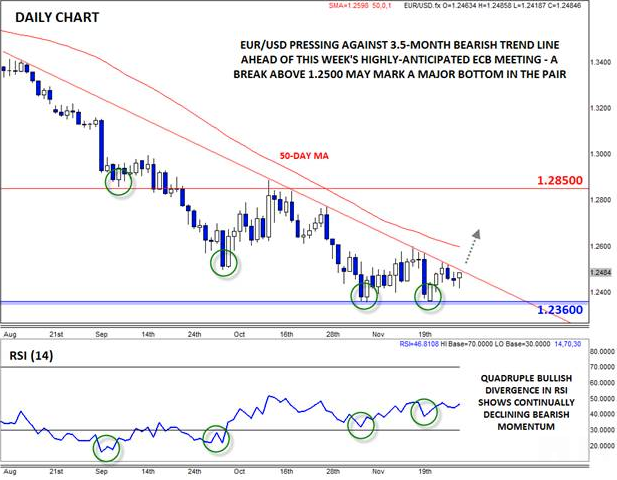
At the beginning of last week, we correctly anticipated the potential for a bounce in EUR/USD, concluding that, “As long as rates stay above horizontal support at 1.2360, EUR/USD could bounce back toward its bearish trend line near 1.25 in a potentially slower holiday week” (see “The Case for a EUR/USD Bounce This Week” for more). Now, as we head into what promises to be a much more volatile and interesting week, the EUR/USD may be poised for a breakout that could set the trading tone for the rest of the year.
Of course, the first week of any month always offers high-impact economic data for traders to digest, but this week’s data may be particularly impactful for EUR/USD. Already today, traders have received lackluster data from the Eurozone, with Manufacturing PMI coming in at 50.1, indicating essentially stagnant growth in the currency bloc’s manufacturing sector, while the three largest economies (Germany, France, and Italy) all showed outright contraction. Looking ahead, EUR/USD traders will have plenty to focus on this week, highlighted by a raft of Fed Speakers today and tomorrow, Services PMI data (Wednesday), the highly-anticipated final ECB meeting of the year (Thursday), and the always-impactful US Non-Farm Payroll report (Friday).
Technical View: EUR/USD
As busy as the economic calendar is this week, EUR/USD’s chart may be even more interesting. After bouncing from previous support at 1.2360, the pair rallied up to its 3.5-month bearish trend line in the lower-1.25s before stalling out last week. As this week begins, the pair is trapped between a proverbial rock (the 3.5-month bearish trend line) and a hard place (strong previous support at 1.2360).
Meanwhile, the latest CFTC Commitment of Traders report shows that futures traders reaching a potential bearish extreme on the pair. Large and Small speculative traders (the green and blue lines in the chart below, respectively), who tend to grow overly bearish at major market bottoms, were net short 224,064 contracts of EUR/USD as of last week. Stated another way, Commercial Hedgers (red line below) were net long the same 200k+ contracts; these types of traders are usually most bullish at major market bottoms. As the chart below shows, positioning is at its most extreme level since July 2012, when EUR/USD bottomed near 1.20.

Source: Barchart.com
After last week’s bottom, the world’s most widely-traded currency pair has now formed an extremely rare quadruple bullish divergence with 14-period RSI indicator, where price has now made four consecutive lower lows, while the RSI indicator has made four higher lows. This development shows declining bearish momentum and is often a precursor to a reversal back higher.
As we often state, only price pays. While the COT report and RSI are indicating an elevated chance of a near-term bottom, prudent traders will want to wait for a break above bearish trend line resistance at 1.2500 before turning bullish. That said, a break below previous support at 1.2360 would renew the bearish trend and open the door for more weakness toward 1.2100 heading into the end of the year.
The most obvious catalyst for a potential breakout, either higher or lower, will be Thursday’s ECB meeting. Some traders are still holding out hope that the ECB will announce its own sovereign QE program at this week’s meeting, so if the ECB chooses to do nothing, a sharp rally through the bearish trend line and 50-day MA is certainly possible.

Source: FOREX.com
For more intraday analysis and market updates, follow us on twitter (@MWellerFX and @FOREXcom).
