Last week, Adam Hartung qualified for the "Mark Twain Award" if there was such a thing. In his article, "Obama Outperforms Reagan On Jobs, Growth & Investing," Adam goes to some length to try and show that unemployment rate, the S&P 500 and economic growth are currently better under the current administration than they were during the Reagan administration.
Adam's first mistake was in the use of the Bureau Of Labor Statistics measure of unemployment (U3) as a comparative benchmark of success as President. To wit:
"“President Obama has achieved a 6.1% unemployment rate in his 6th year, fully one year faster than President Reagan did. At this point in his presidency, President Reagan was still struggling with 7.1% unemployment, and he did not reach into the mid-low 6% range for another full year. So, despite today’s number, the Obama administration has still done considerably better at job creating and reducing unemployment than did the Reagan administration."
While this is "technically true," it falls within Twain's category of a "statistical lie."
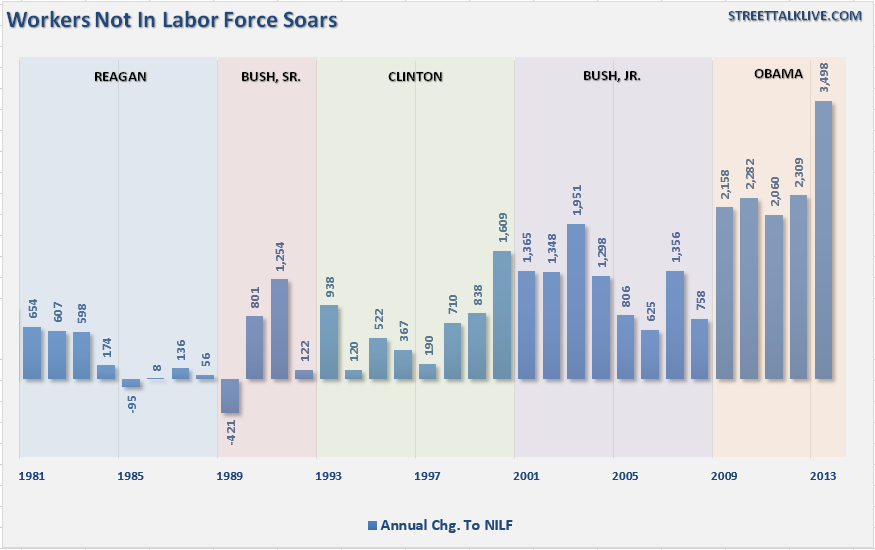
The BLS's measure of unemployment has become obfuscated by the rise in the number of individuals that are no longer counted as part of the labor force. As I discussed in "Why The Unemployment Rate Is Irrelevant," the measure of labor force participation is markedly different between Reagan and Obama.
During Reagan's Presidency, workers that were unemployed longer than 52-weeks were still part of the labor force. This inclusion gave a more accurate measure of the relative size of the labor force overall. However, in 1994, Clinton removed individuals from the labor force that were currently unemployed for longer than 52-weeks. This adjustment immediately improved the overall measure of unemployment by shrinking the labor force by some 500,000 individuals. Since then, the number of individuals no longer counted as part of the labor force has swelled to more than 92 million individuals, or roughly 45% of the working age population (16-54) as of the end of 2013
In other words, a large part of the drop in the U-3 unemployment rate is due to the increase in the number of individuals excluded from the workforce. In theory, if the dropout rate continued at the current pace, the unemployment could fall towards zero allowing the Federal Reserve to win the battle of unemployment, but losing the war of economic prosperity.
The chart below shows the annual change in those not counted as part of the labor force by President from 1981-Present.
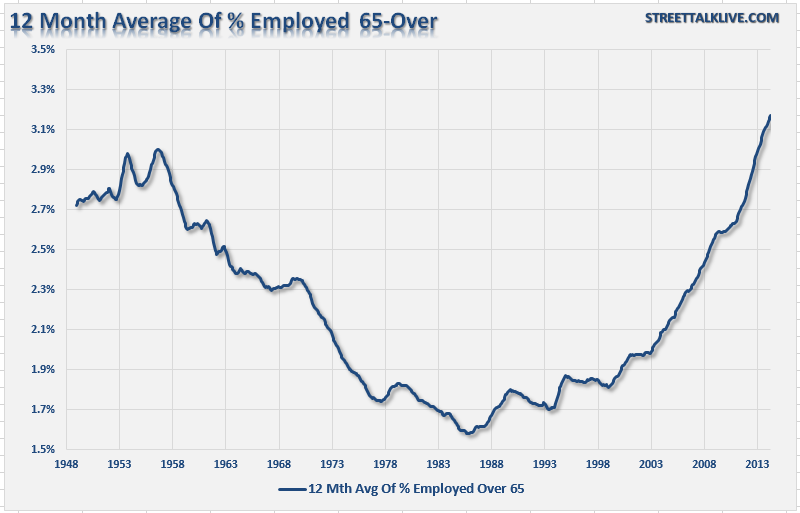
One of the arguments made by Adam is that the slack in the Labor Force Participation Rate is due to "Baby Boomers" retiring. This is hardly the case as I discussed in "Don't Blame Boomers For Not Retiring:"
"Recent statistics show that the average American is woefully unprepared for retirement. On average, 40% of American families are NOT saving for retirement, and of those who are, it is primarily about one year's worth of income. Furthermore, important to this particular conversation, one-fourth of those at retirement age postponed retirement with only 18% being confident of having enough saved for retirement.
With 24% of "baby boomers" postponing retirement, due to an inability to retire, it is not surprising that the employment level of individuals OVER the age of 65, as a percent of the working age population 16 and over, has risen sharply in recent years."
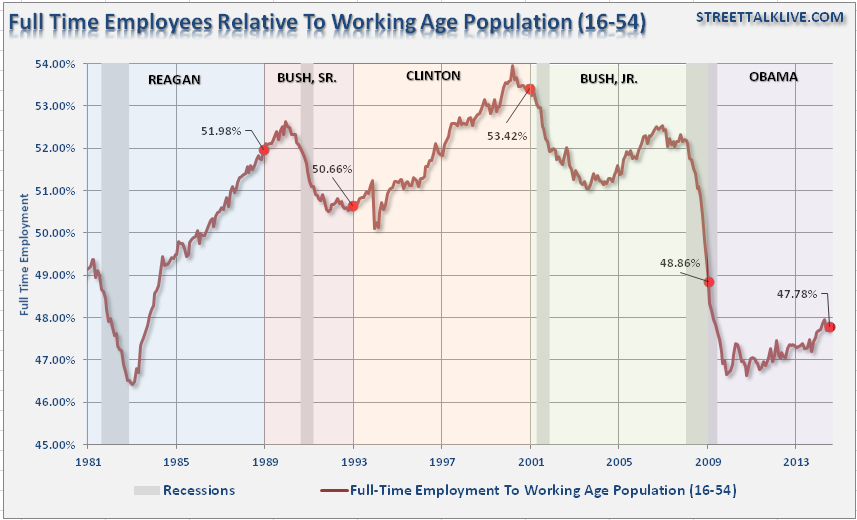
This also explains that while the unemployment RATE has fallen to levels more commonly associated with full-employment, the actual levels of full-time employment have not risen. Critically, in an economy that is nearly 70% driven by consumption, it is ONLY full-time employment that leads to increasing levels of consumption, household formation and ultimately economic growth.
However, for the sake of argument, let's exclude all individuals OVER THE AGE OF 54 from the analysis so we can focus on those of working age 16-54. If the employment has indeed improved better under the Obama Administration then the level of full-time employment for the working age population should have improved markedly.
Unfortunately, that is not the case. At the end of Reagan's administration full-time employment relative to the working age population was at 51.98% versus 47.78% for Obama currently. However, following the recession in 1981, full-time employment under Reagan surged sharply as the real economy gained traction. This has not been the case as full-time employment has remained primarily a function of population growth and little else.
Adam also makes another critical mistake in his analysis using the stock market as a measure of economic performance. To wit:
"“However, it is undeniable that President Obama has surpassed the previous president. Investors have gained a remarkable 220% over the last 5.5 years! This level of investor growth is unprecedented by any administration, and has proven quite beneficial for everyone."
Again, it is a true statement but a "statistical fallacy."
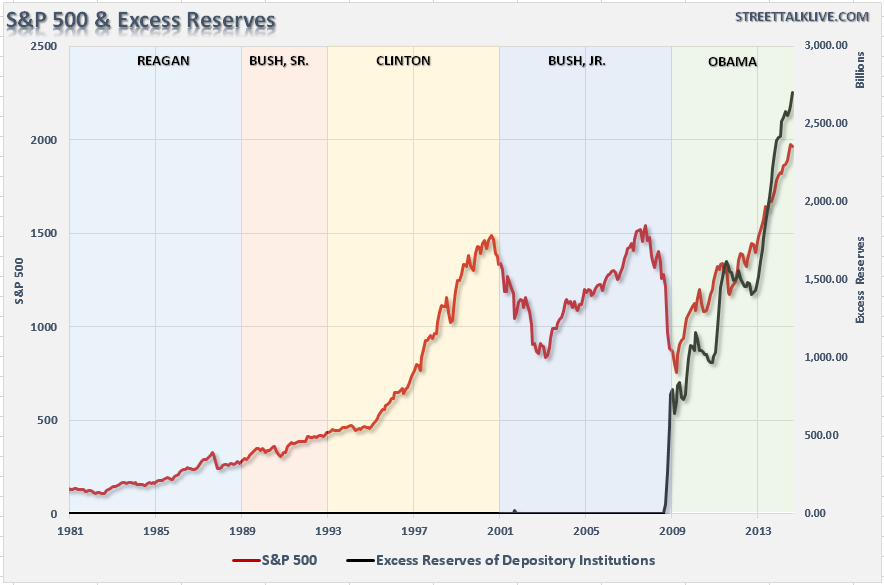
The surge in the stock market since 2009 has not been a representation of underlying economic strength but rather a direct correlation to the expansion of the Federal Reserve's balance sheet. The chart below shows the level of excess reserves of depository institutions and the S&P 500 index by President.
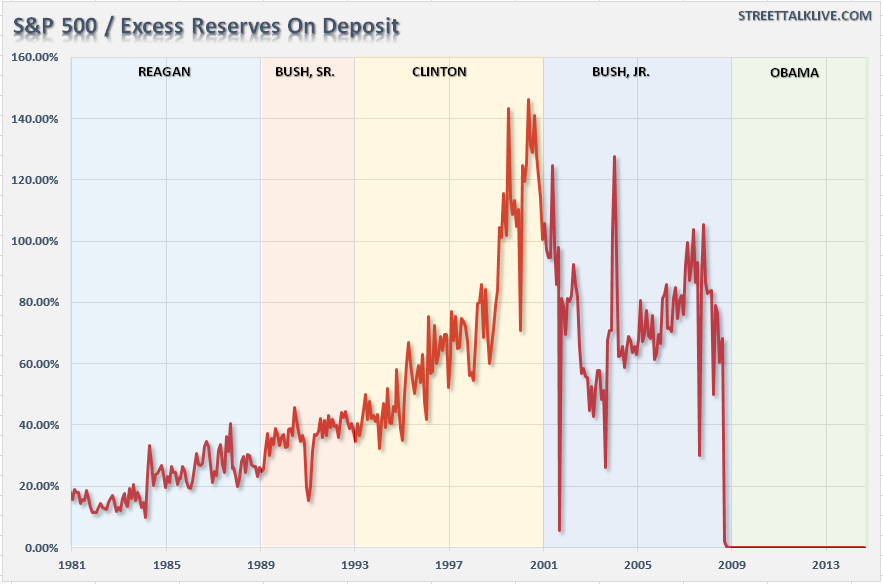
As you will notice, the surge in excess bank reserves beginning in 2009 has correlated with the surge in asset prices that is a benefit that the Reagan did not have. Therefore, to judge which President had better stock market performance we must extract the effect of the Federal Reserve interventions. The next chart shows, by President, the ratio of the S&P 500 Index divided by excess reserves at depository institutions.
During the Reagan administration the stock market was growing at a rate faster than excess reserves which was a reflection of actual economic strength. Since 2009, growth of the stock market has only been a function of monetary interventions rather than broad-based economic prosperity.
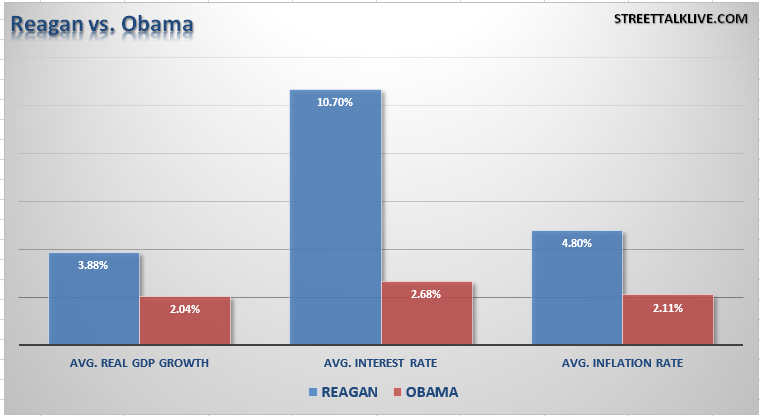
Lastly, there is one point that must be considered. If we are truly going to compare President Obama to Ronald Reagan, it should be on the basis of a level playing field. As shown in the chart below, President Reagan's achieved real, inflation-adjusted, economic growth of 3.88% annually on average as compared to 2.04% under President Obama.
This outperformance was achieved despite headwinds of an average interest rate nearly 5-times that of the current administration and an inflation rate that was more than double.
When considering that President Obama has been able to achieve real economic growth of just 2.04% annually despite historically low levels of inflation and interest rates combined with massive government interventions and balance sheet expansions; it makes his overall performance even more disappointing.
However, I do agree with Adam on his concluding point:
"There are a lot of reasons voters elect a candidate. Jobs and the economy are just one category of factors. But, for those who place a high priority on jobs, economic performance and the markets the data clearly demonstrates which presidential administration has performed best."
Clearly, the right answer was Reagan. Reagan, faced with skyrocketing inflation and interest rates, laid the groundwork that paved the way for a 20-year expansion of economic growth and prosperity. Unfortunately, as we move into the fifth longest economic recovery in history, there is little evidence such an economic "boom" is on the horizon.

