Street Calls of the Week
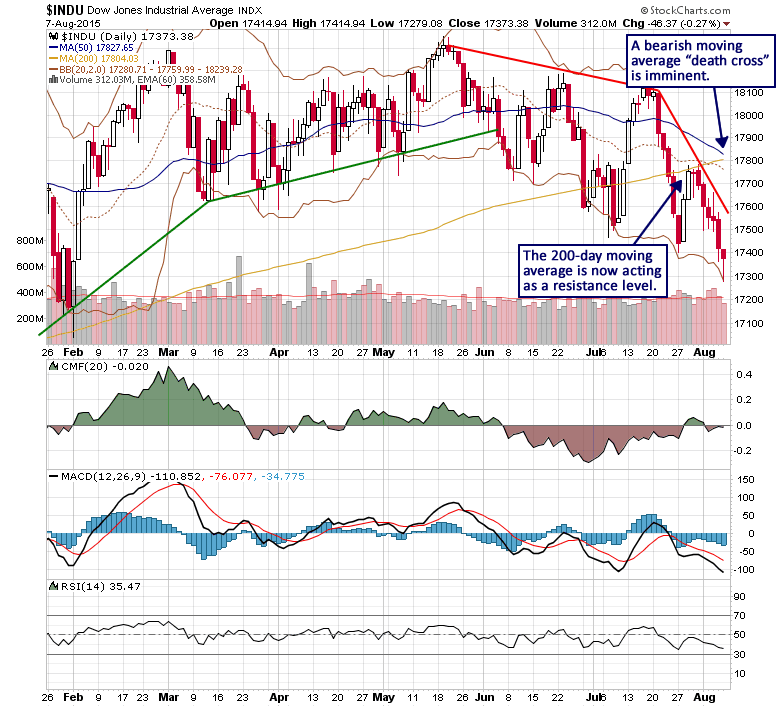
For two months, we have been monitoring developing weakness in the historic stock market bubble that has suggested the bull market from 2009 is becoming susceptible to a long-term reversal. In late July, we noted the formation of negative divergences between the major stock market indices and this week the Dow Jones Industrial Average (DJIA) confirmed its recent break below long-term support at the 200-day moving average. The DJIA has been trending lower since May and its 200-day moving average is now behaving like resistance after acting as support during the past several years. This shift in behavior is an important bearish development that increases the likelihood of the long-term reversal scenario. Additionally, a bearish “death cross” is imminent as the 50-day moving average prepares to cross below the 200-day moving average. This moving average crossover could occur as soon as the next session and would be yet another signal that the bull market from 2009 is in the process of terminating.
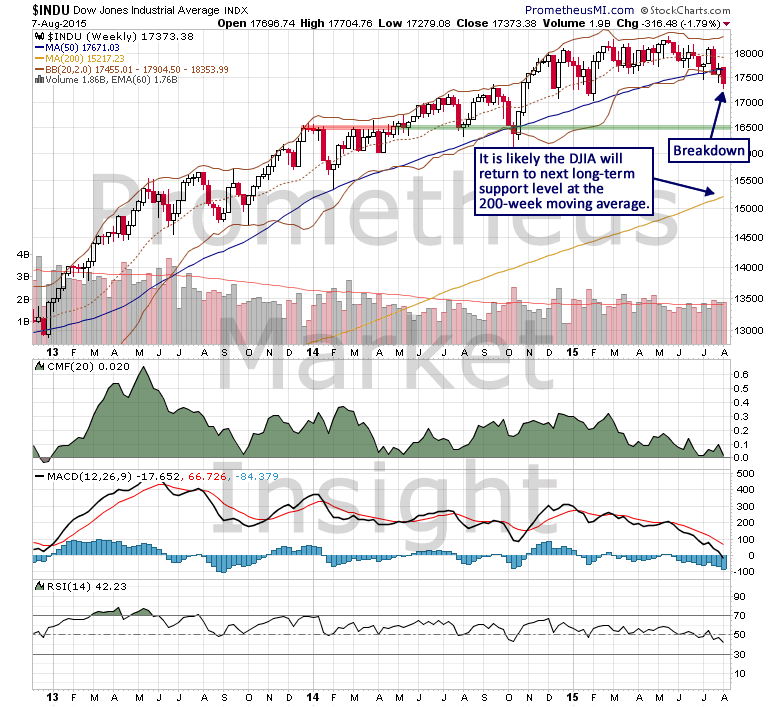
From a weekly perspective, the long-term breakdown of the Dow Jones Industrials has taken the form of a confirmed close well below the 50-week moving average. A subsequent weekly close below current levels would confirm the start of a new intermediate-term downtrend and predict a return to the 200-week moving average.
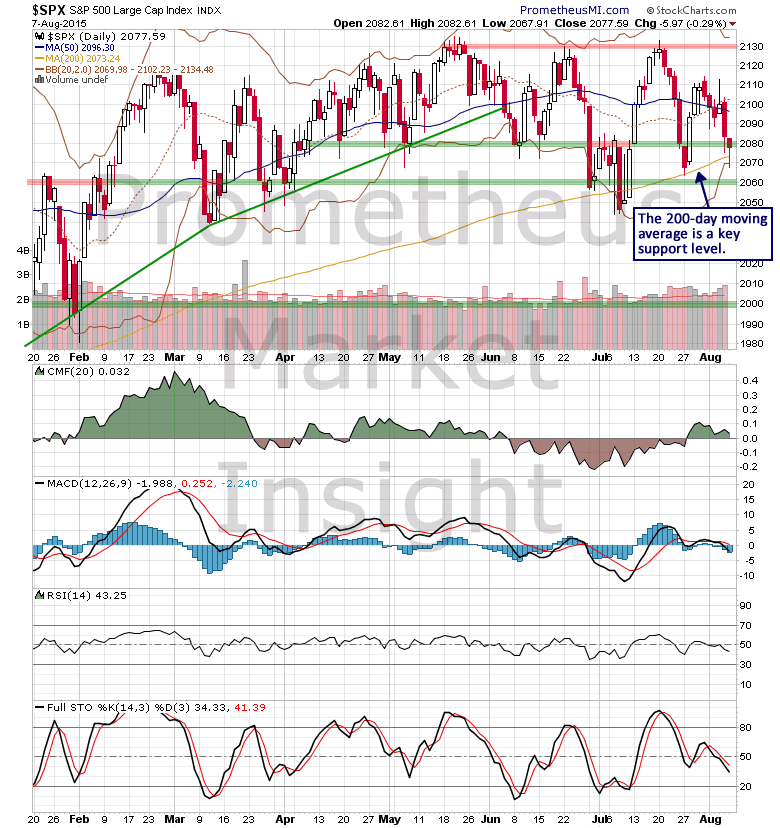
The S&P 500 index has not experienced a similar breakdown, but it has begun a third test of critical long-term support at the 200-day moving average and it is on the verge of confirming the start of a new downtrend.
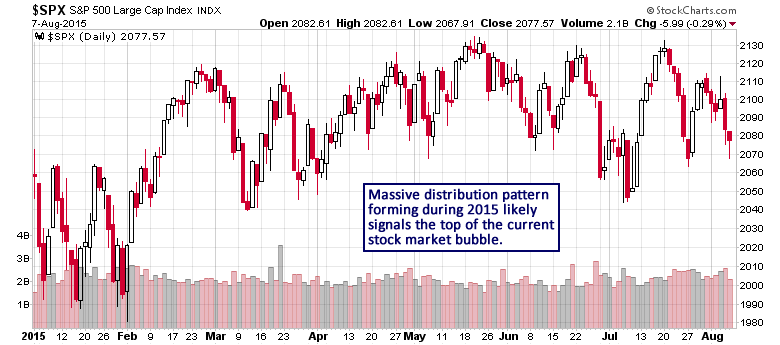
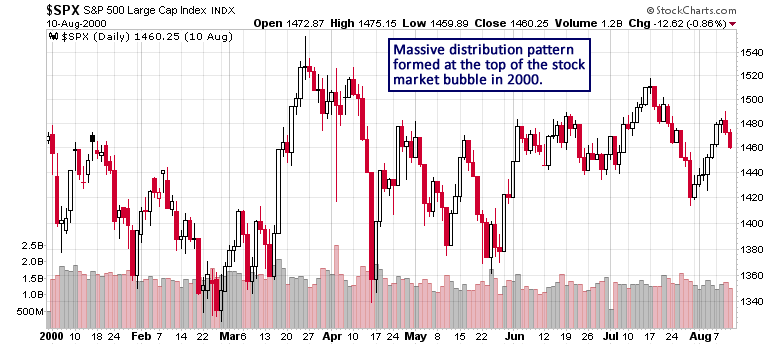
The S&P 500 index has been forming a massive distribution pattern for the past nine months. This type of formation often develops during the terminal phase of a bull market as upward momentum dissipates and long-term holders reduce their positions.
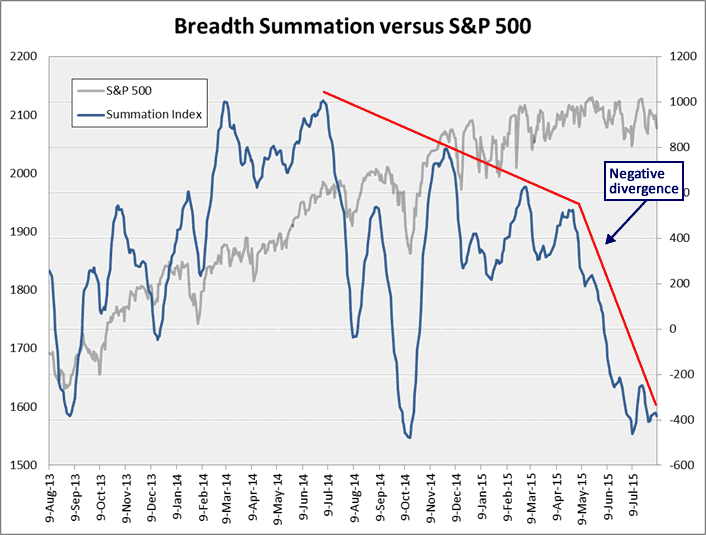
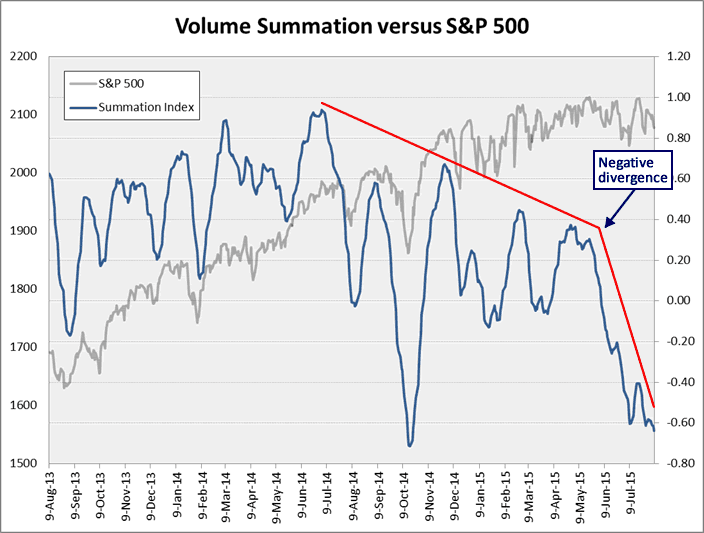
Accompanying this sideways movement in price behavior, we would expect to see significant deterioration in market internals. As expected, breadth and volume summation indices have been negatively diverging from price behavior for the past year and both measures have declined to their lowest levels of the past several years.
A similar distribution pattern formed at the top of the stock market bubble in 2000.
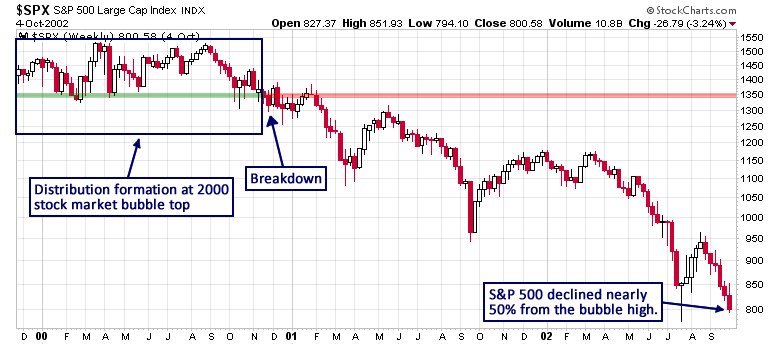
The stock market moved swiftly lower after the formation broke down and the S&P 500 index ultimately lost nearly 50% by the end of 2002.
We are in a similar situation right now as stock market investment risk holds near the highest level of the past 100 years, and it is highly likely that the forthcoming cyclical bear market will result in losses of 40% to 60%. Therefore, we remain fully defensive from an investment perspective and we will continue to monitor market behavior for the next sign that a long-term reversal is in progess.
