"Old resistance becomes new support" is probably one of the most basic idea of technical analysis, but it's one of the most potent form of gauging the market movement if we understand where to look. In this article, I want to share Dow Jones Industrial Average's pivotal levels on different time frames: Monthly (major-term time frame), Weekly (primary-term time frame), and Daily (intermediate to minor-term time frame). But first let's look at the 1970-1985's historical chart and see how Dow Jones dealt with the "old resistance becomes new support" idea.
Lesson from 1970 - 1985
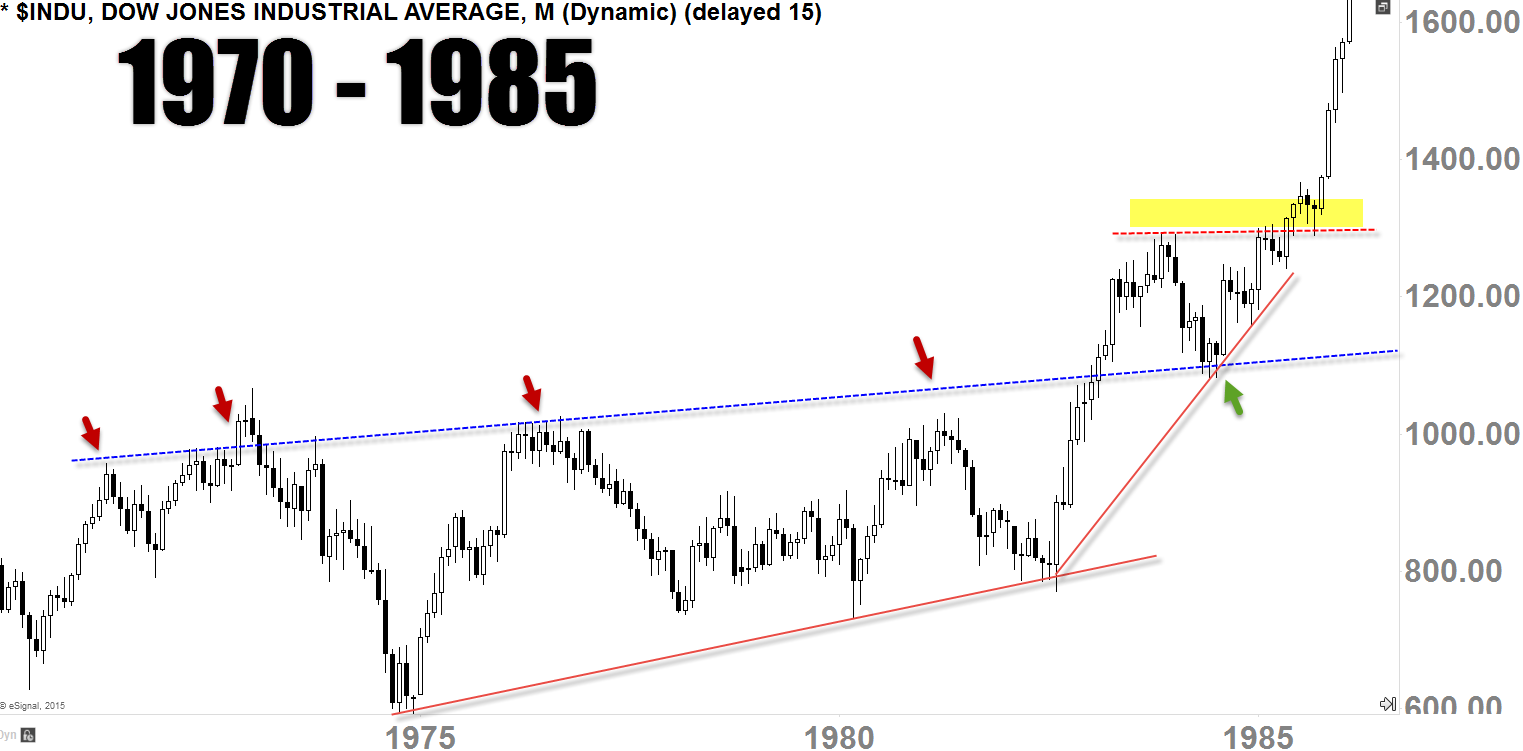
From 1970 to 1985, for about 15-years, Dow Jones Industrial Average started forming rising-channel type of pattern/action before breaking out in the early-1985 (see green arrow). It's important note that the resistance-level (see red arrows) has been prominent for 15-years before it cleared above that level in late-1982, but this was the level where things got interesting, after it cleared above the prominent resistance-level.
So here was where the mind-game began with the question: Is it a bull-trap before rolling over or are we finally breaking out? Obviously no-one has the crystal ball to tell you exactly how it's going to play out, but one can ascertain the potential or possibility of that outcome when it retests that "old resistance" level as "new support". Because this is very important process as the trend does not develop with straight-up move, but rather cultivating of the price-action higher-lows and higher-highs.
In early-1984, Dow Jones started to pullback causing fear into the market, and came back down to that resistance-level (red arrows) once again. This was the very important level because this was the level where Dow Jones can either 'make or break'; we roll back over or truly thrive.
Late-1984, Dow Jones started bouncing back up (see green arrow) thus cultivating/respecting a "new-support"; once we've cleared the late-1983's peak in late-1985 (highlighted), this thing took off like a mad-man for two years (Though market did see a very sharp decline in 1987, primary trend continued on until the year-2000, that's whopping 15-years of primary-term uptrend cultivation)!
Long-Term Sentiment
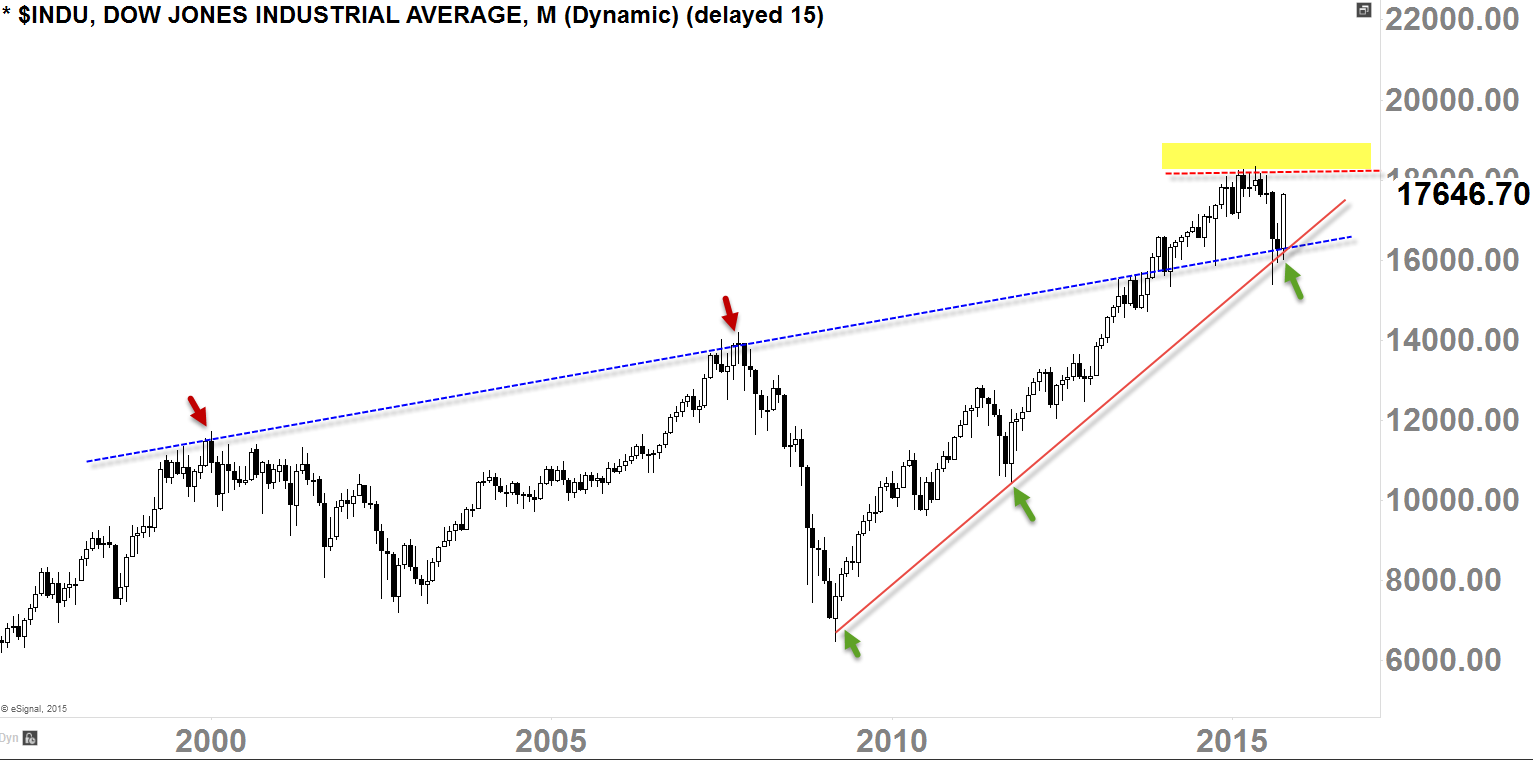
It's absolutely fascinating to me that we are seeing something of similar action/pattern here (as I always say that the history does not repeat exactly the same way, but it does repeat in a similar way). What we have so far is the fact that the "old resistance" is now acting as "new support" looking at this monthly-chart (keep in mind that the latest monthly-candle is not fully solidified as we have another week of trading in this month of October before the month ends).
So, if we take the lesson we've learned from the 1970 - 1985 sentiment; If the price-action can able to thrust above the early-2015's peak (highlighted) at 18300ish, that would fully confirm the old-resistance becoming a new-support, and at that moment, I believe we may see another historical breakout on the Dow Jones like it did back in 1985 
Primary-Term Uptrend
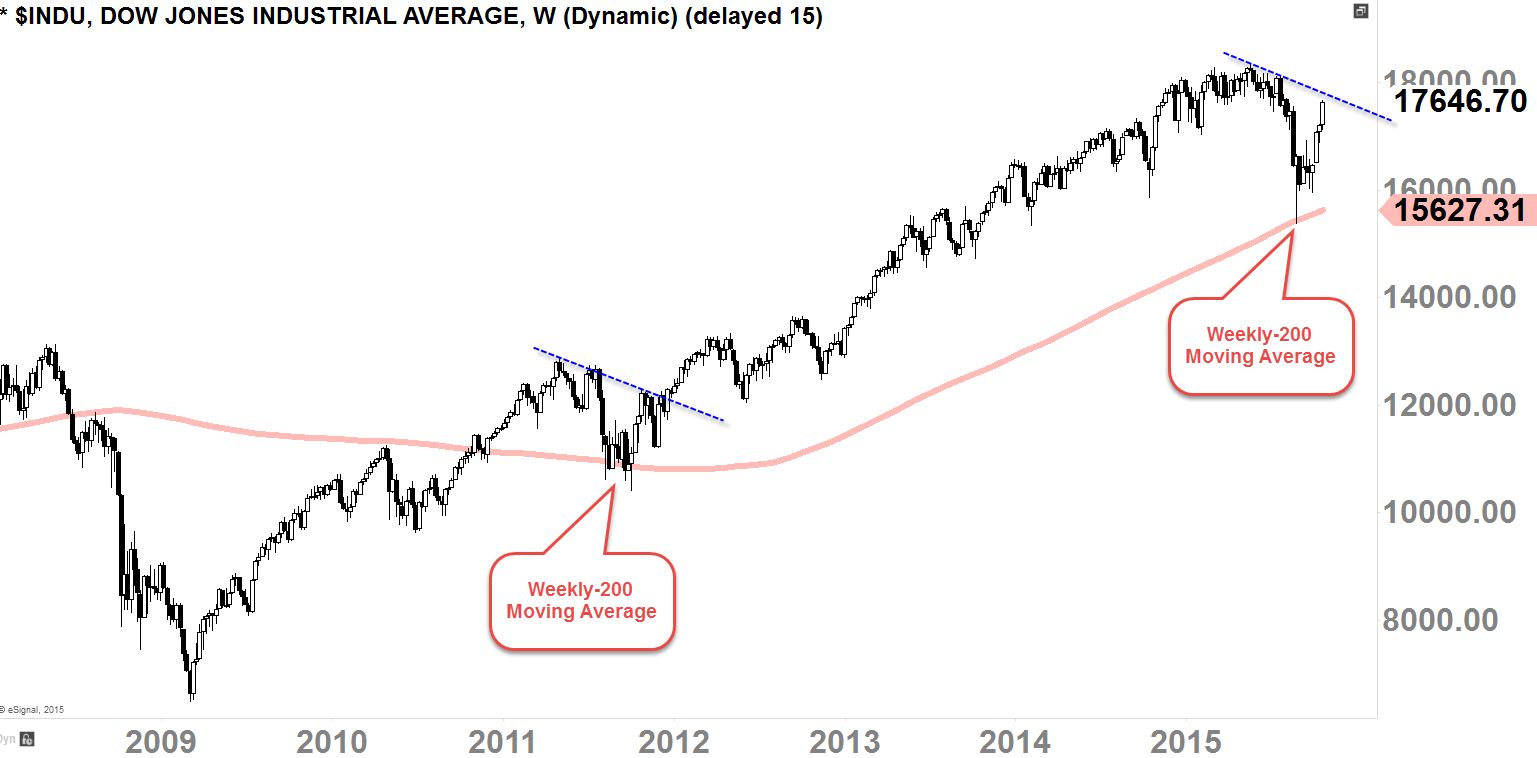
Primary-term uptrend continues on with weekly-200 Moving Average acting as a strong primary-term support as it did back in 2011-correction (not to mention that the same Moving Average was a strong resistance in mid-2010 = "old resistance becomes new support"). With well-cultivated higher-lows and higher-highs in this weekly-chart price-action, I believe that the buyers are starting to gain more confidence looking at things more in a long-term basis. We do have a resistance (blue dotted-line) coming down, which we may see a pullback if we start to struggle to clear above that level in the next 1-3 weeks.
Looking at the weekly-chart below, the primary-term uptrend is still in effect and healthy without any clear signal that it has been reversed ("Trend is assumed to be in effect until it gives us a clear signal that it has been reversed" - Charles Dow) 
Minor to Intermediate-Term Sentiment
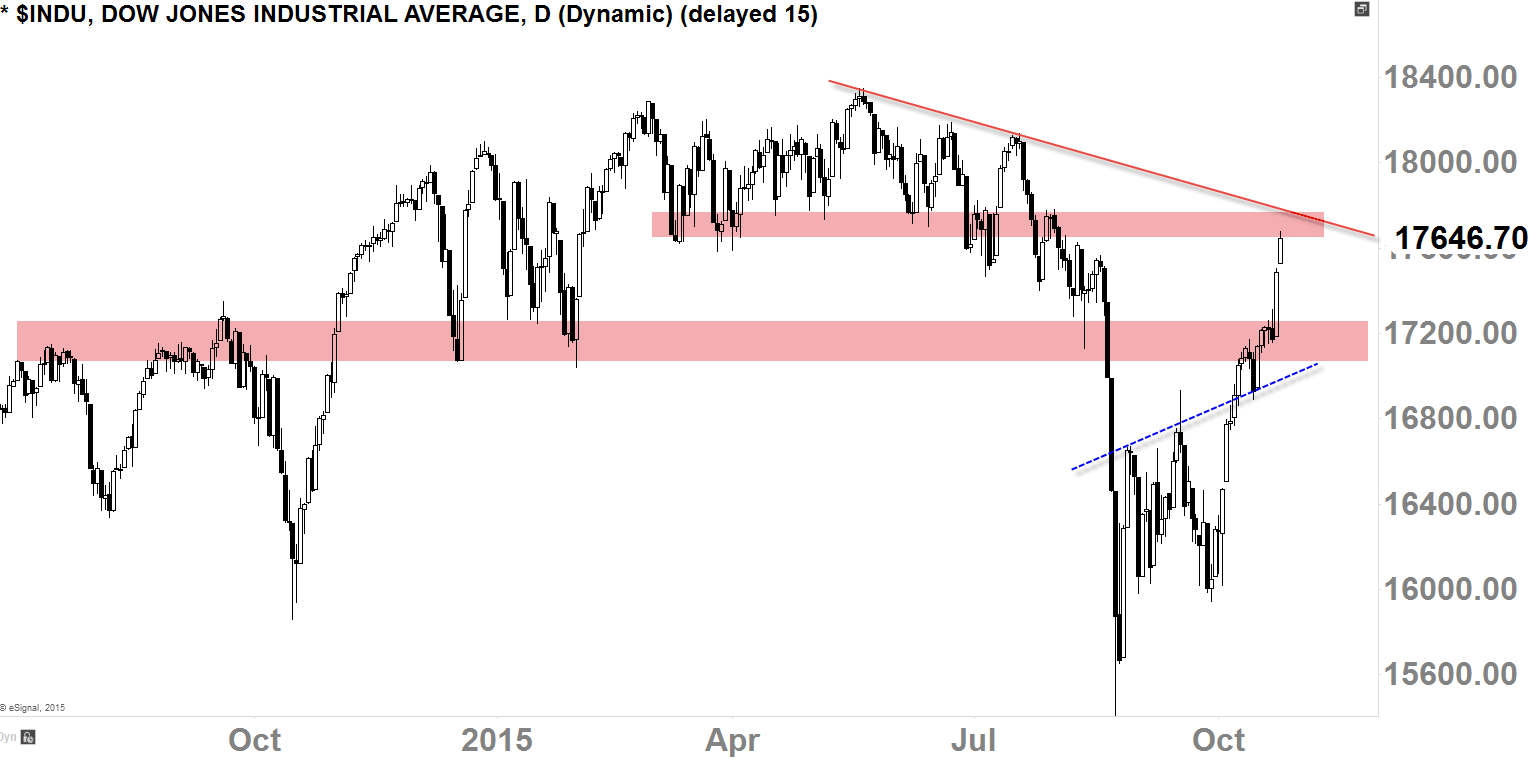
I've been discussing the important levels to watch on one of my Mid-Week Update videos last month, and after clearing the 17200-level in early-October (which was the first level for the bulls to clear), we are now getting close to the 17600-17700 level which is going to be the last level before the complete reversal is in place.
As you can see, that the horizontal-resistance (red box) and the downtrend-resistance (red line) is coinciding in this level; also not to mention, 200-day Moving Average is also hovering in this vicinity (not shown in the chart). This level is going to be very important level going into this and next week. If we start to see price-action falling in the next few weeks, we want to see buyers protect 17200-level for a bounce.
Anywhere well-above 17800-level on the Dow, I believe that's the level where market will start to find confidence, and working towards resuming back up to it's primary-term uptrend.

