
Texas Instruments (NASDAQ:TXN) reported third-quarter 2019 earnings of $1.49 per share, which surpassed the Zacks Consensus Estimate by 8 cents. Further, the figure came within management’s guided range of $1.31-$1.53.
However, the reported figure declined 5.7% year over year but improved 9.6% sequentially.
The company reported revenues of $3.771 billion which came within management’s guided range of $3.65-$3.95 billion. The figure is up 2.8% from the previous quarter.
However, the figure missed the Zacks Consensus Estimate of $3.81 billion. Further, it declined 11% from the year-ago quarter.
Sluggishness in the company's Analog and Embedded Processing segments owing to weakening end-market conditions affected year-over-year top line growth.
This quarter marks the company’s fourth consecutive quarter of declining growth on a year-over-year basis.
Notably, shares of the company have plunged almost 8% in the pre-market trading, which can be primarily attributed to the weaker-than-expected guidance for both earnings and revenues for fourth-quarter 2019.
Nevertheless, the company’s focus on innovation of product portfolio across both the segments is evident from growing research and development (R&D) spending. This continues to be a key catalyst. Further, Texas Instruments continues to increase investments in the automotive and industrial markets, which are anticipated to yield good returns in the long run.
Moreover, the company remains confident on portfolio strength, efficient manufacturing strategies and optimized capital allocation in growth areas.
Coming to the price performance, Texas Instrument has gained 37.7% on a year-to-date basis outperforming the industry’s growth of 25.2%.

End-Market in Detail
Texas Instrument’s revenues were down by upper-single digit in the industrial, automotive and personal electronics markets. This can be attributed to macro-economic headwinds and U.S.-China trade tensions.
Further, the company witnessed sluggishness in the communications equipment market during the reported quarter as evident from revenue decline of 35% year over year. Texas Instruments witnessed weak momentum across all its major customers.
Additionally, the company encountered weakness in the enterprise systems space.
Segments in Detail
Analog: The company generated $2.674 billion from this segment (70.9% of total revenues), which decreased 8% from the year-ago quarter. This can be attributed to weak performance of high-volume, signal chain and power product lines.
Embedded Processing: This segment generated $724 million revenues (19.2% of total revenues), down 19% year over year. This was primarily owing to weak performance of processors and connected microcontrollers.
Other: Revenues in this segment were $373 million (9.9% of total revenues). The figure was down 19% from the year-ago quarter.
Texas Instruments Incorporated Price, Consensus and EPS Surprise
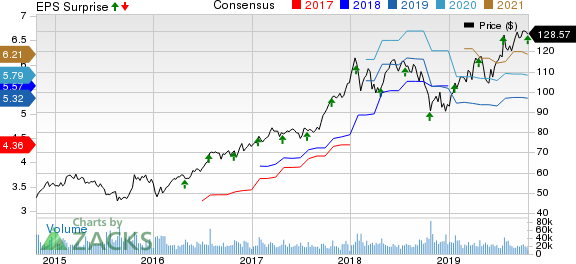
Texas Instruments Incorporated price-consensus-eps-surprise-chart | Texas Instruments Incorporated Quote
Operating Details
Texas Instruments’ gross margin of 64.9% contracted 90 bps from the year-ago quarter.
Selling, general and administrative (SG&A) and R&D expenses were $399 million and $379 million, which expanded 130 bps and 90 bps, respectively, in the reported quarter.
Operating margin was 42.1%, contracting 340 bps from the prior-year quarter.
Balance Sheet and Cash Flow
As of Sep 30, 2019, cash and short-term investments balance came in $5.1 billion, which increased from $4.2 billion as of Jun 30, 2019.
At the end of the reported quarter, the company had long-term debt of $5.3 billion, up from $4.6 billion in the prior quarter.
The company generated $1.9 billion of cash from operations, up from $1.8 billion in the previous quarter.
Capex was $149 million in the third quarter. Further, free cash flow stood at $1.84 billion.
Additionally, Texas Instruments paid out dividends worth $721 million during the reported quarter. Further, it repurchased shares worth $456 million.
Guidance
For fourth-quarter 2019, the company expects revenues between $3.07 billion and $3.33 billion. The Zacks Consensus Estimate for revenues is pegged at $3.59 billion.
Earnings are expected in the range of $0.91-$1.09 per share. The guidance includes an estimated $5 million discrete tax benefit. The Zacks Consensus Estimate for earnings is pegged at $1.28.
Zacks Rank & Stocks to Consider
Currently, Texas Instruments carries a Zacks Rank #4 (Sell).
Some better-ranked stocks in the broader technology sector are NetEase, Inc. (NASDAQ:NTES) , Itron, Inc. (NASDAQ:ITRI) and Five9, Inc. (NASDAQ:FIVN) . All the stocks sport a Zacks Rank #1 (Strong Buy). You can see the complete list of today’s Zacks #1 Rank stocks here.
Long-term earnings growth rate for NetEase, Itron and Five9 is currently pegged at 31.93%, 25 and 10%, respectively.
Wall Street’s Next Amazon (NASDAQ:AMZN)
Zacks EVP Kevin Matras believes this familiar stock has only just begun its climb to become one of the greatest investments of all time. It’s a once-in-a-generation opportunity to invest in pure genius.
Click for details >>
NetEase, Inc. (NTES): Free Stock Analysis Report
Five9, Inc. (FIVN): Free Stock Analysis Report
Texas Instruments Incorporated (TXN): Free Stock Analysis Report
Itron, Inc. (ITRI): Free Stock Analysis Report
Original post