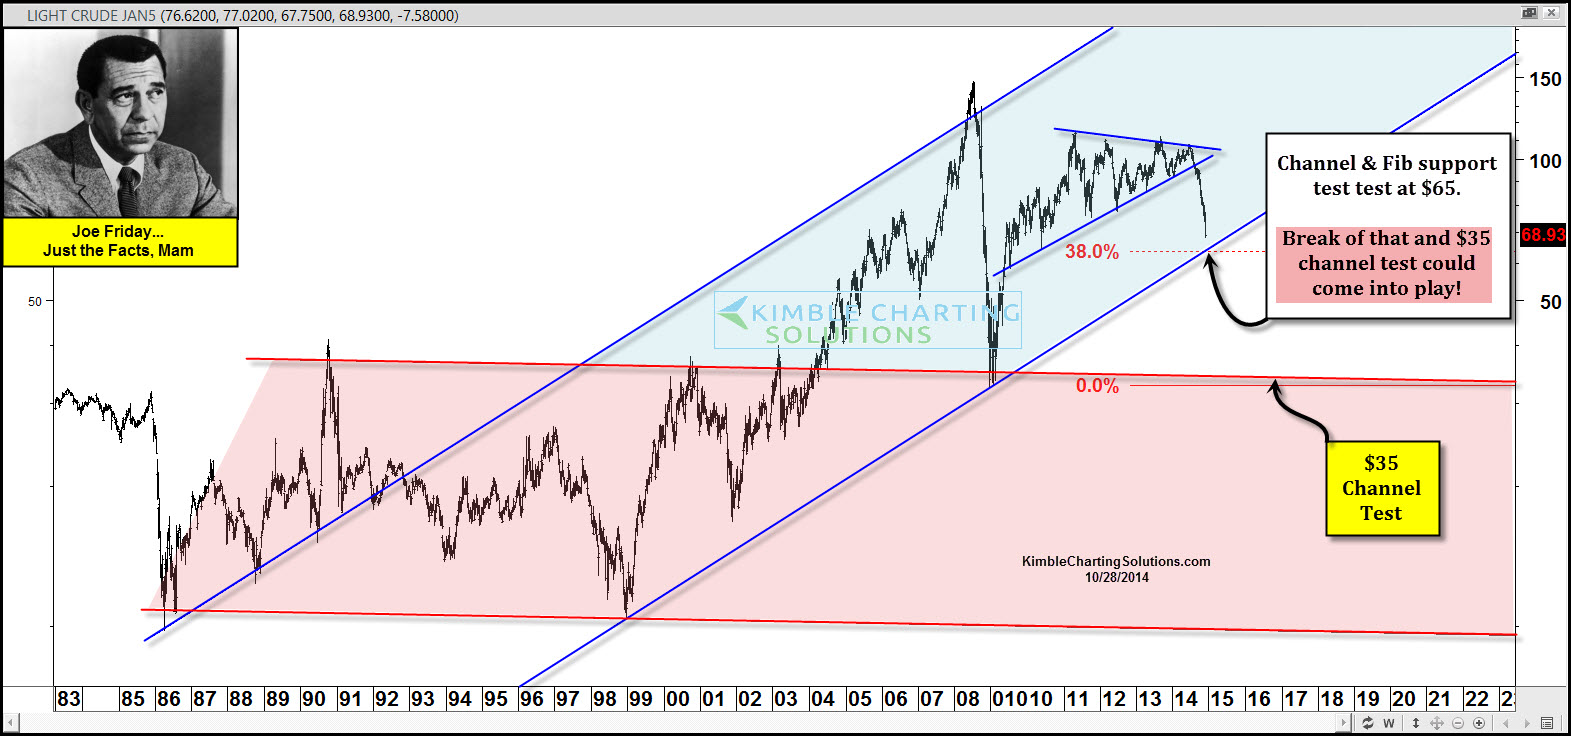
About 60 days ago the Power of the Pattern suggested that the "most important commodity on the planet" should be on its way to the $70 zone if the bottom of the pennant pattern broke support.
Well, some 64 days later and crude oil has broken the bottom of the pennant pattern and has hit that $70 target. On the chart above you can see that two "potential support" points (channel support and Fibonacci 38%) meet at the $65 zone.
Over the past two months, I've been suggesting two things -- crude oil should be shorted and it could reach these levels and it would end up impacting the stock market in a negative way. I have been right on the trade and, so far, very wrong on its global impact.
Pay Attention!
If support line dating back to the late 1990's doesn't hold, crude's next important channel support comes into play around $35.
In my humble opinion, this is not only a critical support test for crude, it's a test for the macro picture as well. Should crude bust through support and find itself working toward the $35 level, I would be shocked if it doesn't end up impacting stocks in a negative way -- sending the message that the world is slowing down.
Which stock should you buy in your very next trade?
AI computing powers are changing the stock market. Investing.com's ProPicks AI includes 6 winning stock portfolios chosen by our advanced AI. In 2024 alone, ProPicks AI identified 2 stocks that surged over 150%, 4 additional stocks that leaped over 30%, and 3 more that climbed over 25%. Which stock will be the next to soar?
Unlock ProPicks AI
